ACT Science : Biology
Study concepts, example questions & explanations for ACT Science


All ACT Science Resources
Example Questions
Example Question #11 : How To Find Data Representation In Biology
|
|
G |
g |
|
g |
Gg |
gg |
|
g |
Gg |
gg |
Scientist’s believe they have found the gene accountable for intelligence. The allele “G” is dominant, and the allele “g” is recessive. The intelligence gene is optimally expressed in the homozygous recessive form. The chart above shows the trait in the heterozygous form and the homozygous form. The form “gg” is from the mother, and “Gg” is from the father. The parents want to know what the gene might look like in their child.
What genotypes would two parents want to have to increase their chances of a child exhibiting an optimal intelligence phenotype?
There are various possible parental genotype combinations that could give the desired result.
"gg" and "gg"
"Gg" and "GG"
"GG" and "gg"
"gG" and "gg"
"gg" and "gg"
Two parents with genotype "gg" would create a 100 percent chance of having a child with the "gg" genotype, which results in the optimal intelligence phenotype.
Example Question #11 : Biology

The chart above shows the height growth of three different plant species after a period of 2 weeks. Each plant species was grown in 4 different soil mediums. All the plants were grown in the same environment with equal amounts of light, water, and oxygen.
What could be added to this experiment to improve the data representation?
All of the options listed would improve the data representation.
A supplemental chart listing the soil composition breakdown for each soil medium would be helpful.
The data would be better represented with "Type of Plant" on the X-axis with four points above for each growth medium.
The Y-axis on the chart should be labeled.
The chart should have a title.
All of the options listed would improve the data representation.
All of the options listed would make the data representation better.
Example Question #12 : Act Science
A new drug is in its clinical trial phase. The graph below shows the data for participants sleep patterns before medication use and then after using the medication for three months. Series 1 shows the average hours slept a night for each participant prior to medication. Series 2 shows the average hours slept a night for each participant after three months of use. The average hours slept a night was obtained by recording sleep every night for one month, and then finding the average. Patients one through five took a placebo pil, not the actual Moonlight medication. Note: The y-axis is measured in hours slept a night, while the x-axis lists each anonymous patient numerically.

The overall trend when comparing sleep before and after mediciation use is __________.
All patients experienced an increase in hours slept when on the medication, except those taking the placebo.
Patients who slept the most prior to the medication saw the greatest increase in hours slept when on the medication.
Patients who slept the most prior to the medication saw the least increase in hours slept when on the medication.
Patients who slept the least prior to the medication saw the greatest increase in hours slept when on the medication.
There was not a difference in the average hours slept a night by a patient before the medication use and after the medication use.
Patients who slept the least prior to the medication saw the greatest increase in hours slept when on the medication.
Looking at the graph, one will see the patients who slept the least before medication usage (patients 4, 6, and 9), had the largest increase in hours slept. Further, patient 7 and patient 3 had the greatest amount of hours slept prior to medication usage. These two patients had the smallest increase in average sleeping hours.
Example Question #11 : Biology
A new drug is in its clinical trial phase. The graph below shows the data for participants sleep patterns before medication use and then after using the medication for three months. Series 1 shows the average hours slept a night for each participant prior to medication. Series 2 shows the average hours slept a night for each participant after three months of use. The average hours slept a night was obtained by recording sleep every night for one month, and then finding the average. Patients one through five took a placebo pil, not the actual Moonlight medication. Note: The y-axis is measured in hours slept a night, while the x-axis lists each anonymous patient numerically.
What information would strengthen the experiment?
All of the answers listed would strengthen the experiment.
Data comparing the number of times a patient wakes up in the middle of the night prior to and after medication usage.
Patient 4 and patient 5 both had family deaths occur during the first month of testing.
Another experiment using the medication that shows only female patients saw an increase in hours slept a night.
Statistical data results showing those on the placebo had the same increase in hours slept a night as those taking the medication.
Data comparing the number of times a patient wakes up in the middle of the night prior to and after medication usage.
This experiment takes into account the total average hours slept each night. While the medication seems to improve the total hours slept, it leaves out how consecutive the hours. An individual who sleeps a total of seven hours a night but wakes up five times a night will not show an improvement based on the way the results are measured.
Example Question #12 : How To Find Data Representation In Biology
A new drug is in its clinical trial phase. The graph below shows the data for participants sleep patterns before medication use and then after using the medication for three months. Series 1 shows the average hours slept a night for each participant prior to medication. Series 2 shows the average hours slept a night for each participant after three months of use. The average hours slept a night was obtained by recording sleep every night for one month, and then finding the average. Patients one through five took a placebo pil, not the actual Moonlight medication. Note: The y-axis is measured in hours slept a night, while the x-axis lists each anonymous patient numerically.
The patient with the least improvement in hours slept with medication usage is __________.
Patient nine
Patient three
Patient seven
Patient four
Patient two
Patient seven
According to the graph, patient seven has the least difference in hours slept (y-axis).
Example Question #14 : How To Find Data Representation In Biology
Scientists studied a species of termites and looked at their foraging habitats across the United States. The termite’s population in a given tree was measured by the level of decomposition within a tree due to the termites eating the bark. The experiment also kept track of the level of shade tolerance for each species of tree. For the species of trees in this experiment, shade tolerance fell into two main categorizes- shade tolerant (ST) and intermediate shade (IS). Lastly, they recorded the average amount of rainfall in that given month for the species location being observed. The chart below summarizes the data. Scientists hypothesized that the level of decomposition would be highest in tree species with a higher average rainfall. In addition, they hypothesized trees allowing more shade would allow for more termites, and in turn more decomposition.
|
|
Tsuga canadensis |
Morus rubra |
Pinus strobus |
Acer rubrum |
Arbutus menziesii |
Quercus lobata |
Juniperus scopulorum |
|
Decomposition (in ccm) |
2.38 |
3.21 |
1.01 |
.970 |
2.89 |
1.31 |
4.03 |
|
Shade tolerance |
ST |
ST |
IS |
IS |
ST |
IS |
ST |
|
Average rainfall |
47.27 |
50.89 |
43.26 |
41.65 |
46.87 |
44.98 |
52.75 |
Based on the data, which tree species could be described as most favorable for termites?
Pinus strobus
Juniperus scopulorum
Acer rubrum
Quercus lobata
Tsuga canadensis
Juniperus scopulorum
Juniperus scopulorum has the highest amount of decomposition. This experiment measured a termite's population in a given species by the amount of decomposition. This species had the greatest amount of decomposition, therefore the greatest population of termites.
Example Question #15 : How To Find Data Representation In Biology
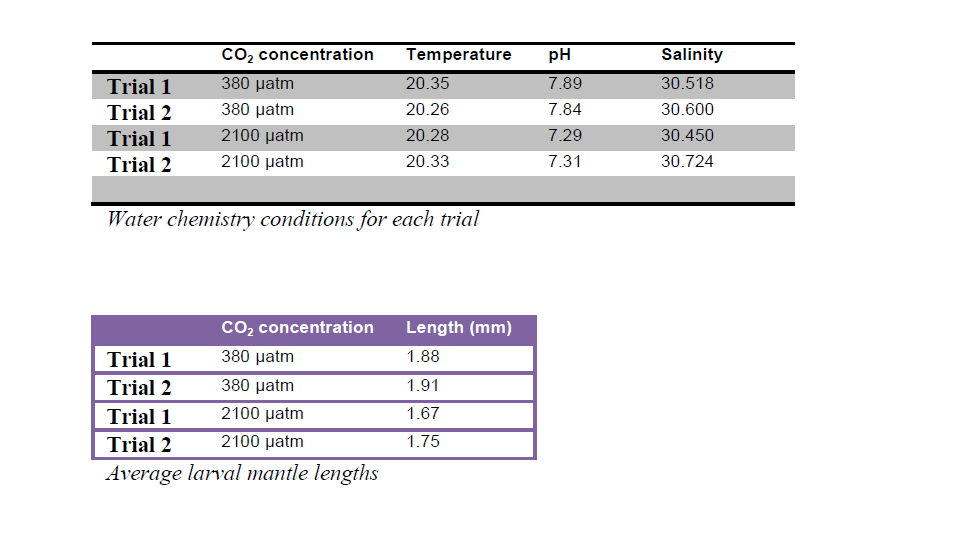
The significant increase in atmospheric carbon dioxide since pre-industrial levels can be seen in the world’s oceans which absorb the CO2 and in turn undergo changes in chemistry. The consequences of increased CO2 include acidification of seawater and a decrease in carbonate ion (CO32-) concentration.
Changes in seawater chemistry affect marine organisms. The early life stages of invertebrates, such as squid, may be particularly vulnerable to changes in carbon dioxide levels. Acting as both predator and prey, squid are a significant component of marine ecosystems. For example, fish and sea birds, such as tuna and albatross, are dependent on squid as a source of prey. Furthermore, the fishing industry is impacted by the health of squid populations. California fisheries produce the majority of market squid.
In order to determine how increased levels of carbon dioxide affect the development of squid, eggs were hatched in two different conditions: normal (380 µatm) and elevated (2100 µatm) levels of CO2. The time to hatch and the size of the larval mantle (the anatomical feature that includes the body wall and fins) were measured and recorded. Two trials were conducted for each carbon dioxide concentration.
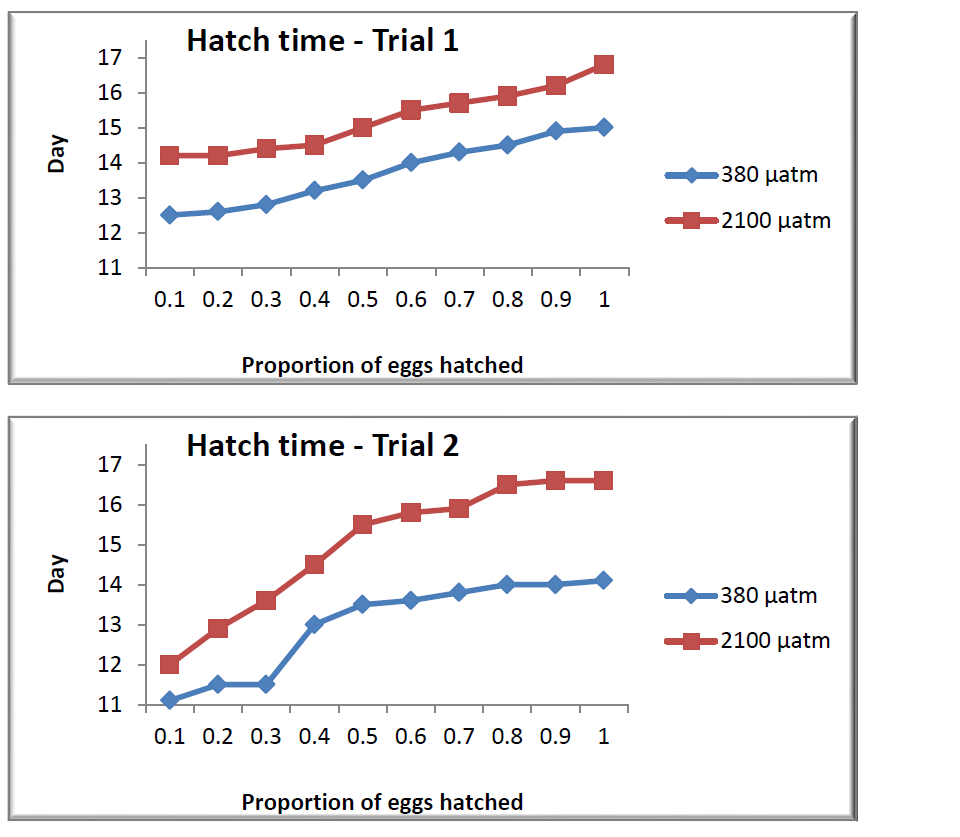
Compared to the hatch time data in Trial 1, _________.
Fewer eggs hatched in the elevated CO2 group of Trial 2
Trial 2 showed a more stable curve for both conditions
There was a more significant difference between normal and elevated groups in Trial 2
The difference between normal and elevated CO2 hatch times was less pronounced in Trial 2
There was a more significant difference between normal and elevated groups in Trial 2
Comparing the difference between the curves of normal and elevated carbon dioxide egg hatching data, we see that the lines diverge more so in Trial 2:
Example Question #16 : How To Find Data Representation In Biology
The significant increase in atmospheric carbon dioxide since pre-industrial levels can be seen in the world’s oceans which absorb the CO2 and in turn undergo changes in chemistry. The consequences of increased CO2 include acidification of seawater and a decrease in carbonate ion (CO32-) concentration.
Changes in seawater chemistry affect marine organisms. The early life stages of invertebrates, such as squid, may be particularly vulnerable to changes in carbon dioxide levels. Acting as both predator and prey, squid are a significant component of marine ecosystems. For example, fish and sea birds, such as tuna and albatross, are dependent on squid as a source of prey. Furthermore, the fishing industry is impacted by the health of squid populations. California fisheries produce the majority of market squid.
In order to determine how increased levels of carbon dioxide affect the development of squid, eggs were hatched in two different conditions: normal (380 µatm) and elevated (2100 µatm) levels of CO2. The time to hatch and the size of the larval mantle (the anatomical feature that includes the body wall and fins) were measured and recorded. Two trials were conducted for each carbon dioxide concentration.
For water with a carbon dioxide concentration of 380 µatm, when would half of squid eggs be expected to be hatched?
Between days 13 and 14
Between days 16 and 17
Between days 12 and 13
Between days 11 and 12
Between days 13 and 14
The question asks us to determine when half of the squid eggs would be hatched in the 380 µatm group (blue line). For this question, you can ignore the red lines. On the 

Example Question #17 : How To Find Data Representation In Biology
The significant increase in atmospheric carbon dioxide since pre-industrial levels can be seen in the world’s oceans which absorb the CO2 and in turn undergo changes in chemistry. The consequences of increased CO2 include acidification of seawater and a decrease in carbonate ion (CO32-) concentration.
Changes in seawater chemistry affect marine organisms. The early life stages of invertebrates, such as squid, may be particularly vulnerable to changes in carbon dioxide levels. Acting as both predator and prey, squid are a significant component of marine ecosystems. For example, fish and sea birds, such as tuna and albatross, are dependent on squid as a source of prey. Furthermore, the fishing industry is impacted by the health of squid populations. California fisheries produce the majority of market squid.
In order to determine how increased levels of carbon dioxide affect the development of squid, eggs were hatched in two different conditions: normal (380 µatm) and elevated (2100 µatm) levels of CO2. The time to hatch and the size of the larval mantle (the anatomical feature that includes the body wall and fins) were measured and recorded. Two trials were conducted for each carbon dioxide concentration.
On average, approximately how many days apart do 100% of the eggs hatch in the normal and elevated 
16
3
less than 1
7
3
We are asked to find the number of days between the hatching of all of the eggs in the normal (blue line) and elevated (red line) carbon dioxide groups. To do this, locate the endponts of the lines (at 
Example Question #18 : How To Find Data Representation In Biology
The significant increase in atmospheric carbon dioxide since pre-industrial levels can be seen in the world’s oceans which absorb the CO2 and in turn undergo changes in chemistry. The consequences of increased CO2 include acidification of seawater and a decrease in carbonate ion (CO32-) concentration.
Changes in seawater chemistry affect marine organisms. The early life stages of invertebrates, such as squid, may be particularly vulnerable to changes in carbon dioxide levels. Acting as both predator and prey, squid are a significant component of marine ecosystems. For example, fish and sea birds, such as tuna and albatross, are dependent on squid as a source of prey. Furthermore, the fishing industry is impacted by the health of squid populations. California fisheries produce the majority of market squid.
In order to determine how increased levels of carbon dioxide affect the development of squid, eggs were hatched in two different conditions: normal (380 µatm) and elevated (2100 µatm) levels of CO2. The time to hatch and the size of the larval mantle (the anatomical feature that includes the body wall and fins) were measured and recorded. Two trials were conducted for each carbon dioxide concentration.
For which group was the rate of egg hatching the slowest?
Trial1, normal CO2
Trial 2, normal CO2
Trial 2, elevated CO2
Trial 1, elevated CO2
Trial 2, elevated CO2
Here we are asked to find which of the lines below represents the slowest rate of egg hatching. Since 100% of the eggs eventually hatched for each group, the question becomes for which group did hatching span the most number of days. In the elevated group (red line) in Trial 2, egg hatching began at day 12 and lasted until about day 17. Since this represents the longest period of egg hatching activity among the groups, the rate of hatching is the slowest in the Trial 2, elevated group.


All ACT Science Resources

