SAT II Math II : Transformations
Study concepts, example questions & explanations for SAT II Math II


All SAT II Math II Resources
Example Questions
Example Question #1 : Transformations
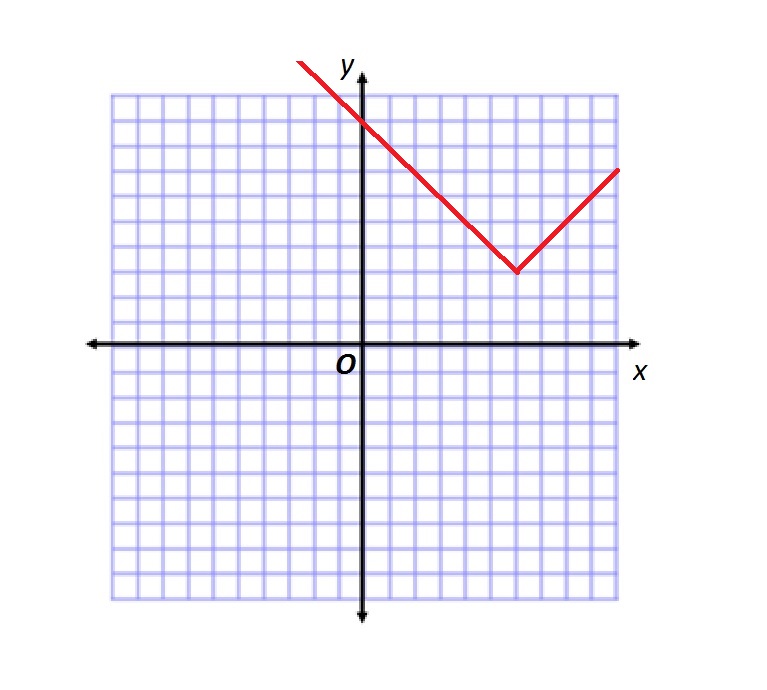
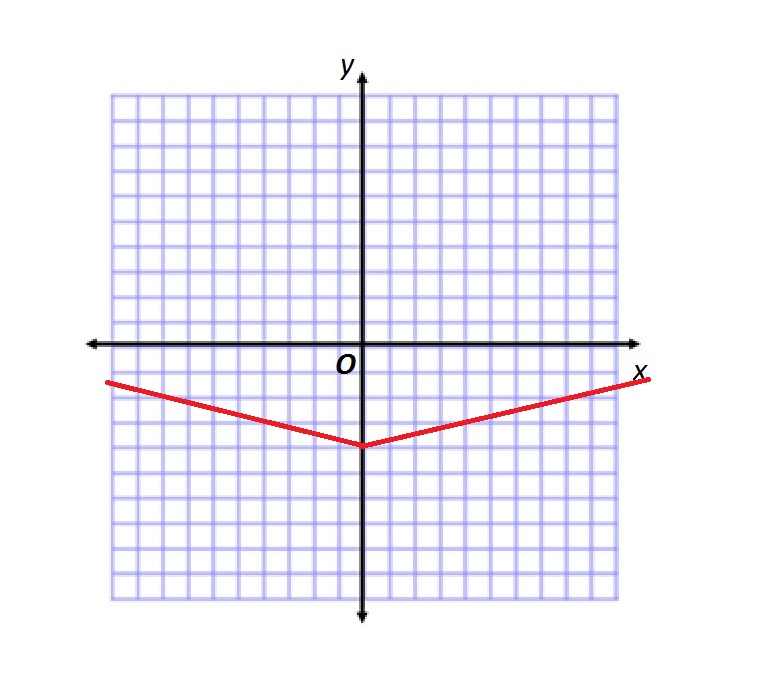
Refer to the above figure.
Which of the following functions is graphed?
 = |x +6| + 3")
 = |x - 6| + 3")
The correct answer is not given among the other responses.
 = |x+3| + 6")
 = |x-3| + 6")
Below is the graph of  = |x|")
The given graph is the graph of 

The function graphed is therefore
 = f(x-h) + k")

 = f(x-6) +3")
= | x-6 | + 3")
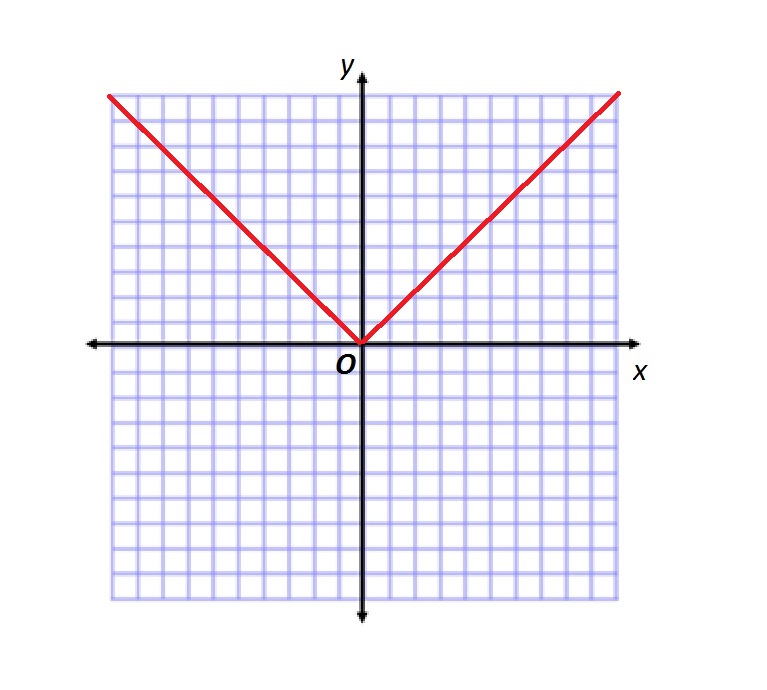
Example Question #431 : Sat Subject Test In Math Ii
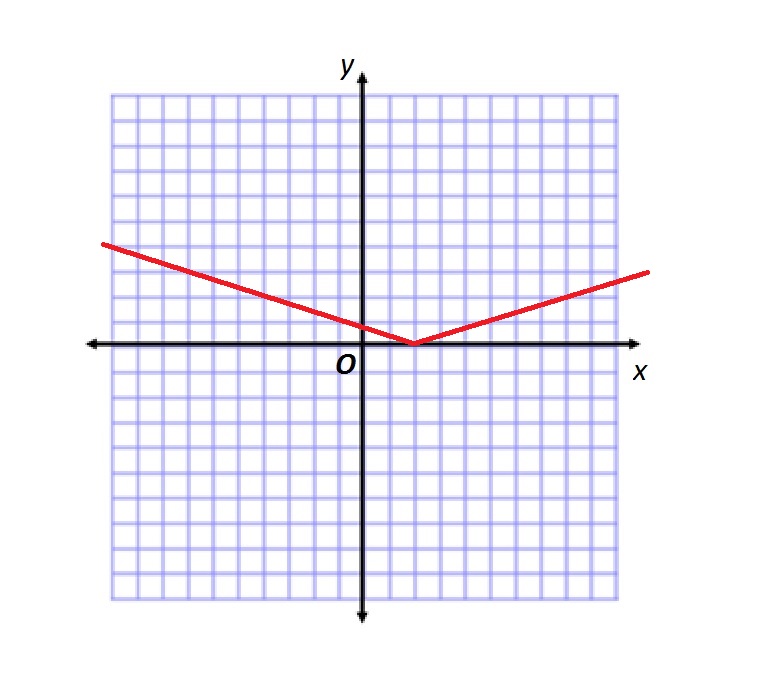
Refer to the above figure.
Which of the following functions is graphed?
 =\left | \frac{1}{2} x \right |+ 3")
 = |3x +6|")
 = |2x| + 3")
 = \left |3x + \frac{3}{2} \right |\textup{}")
 = |2x + 6|")
Below is the graph of
If the graph of 
")
")
 = 2f(x)")
is formed. If the graph is then shifted upward by three units, the new graph is
 = 2f(x) + 3")
Since the starting graph was
 = 2 |x| + 3")
 = |2x| + 3")
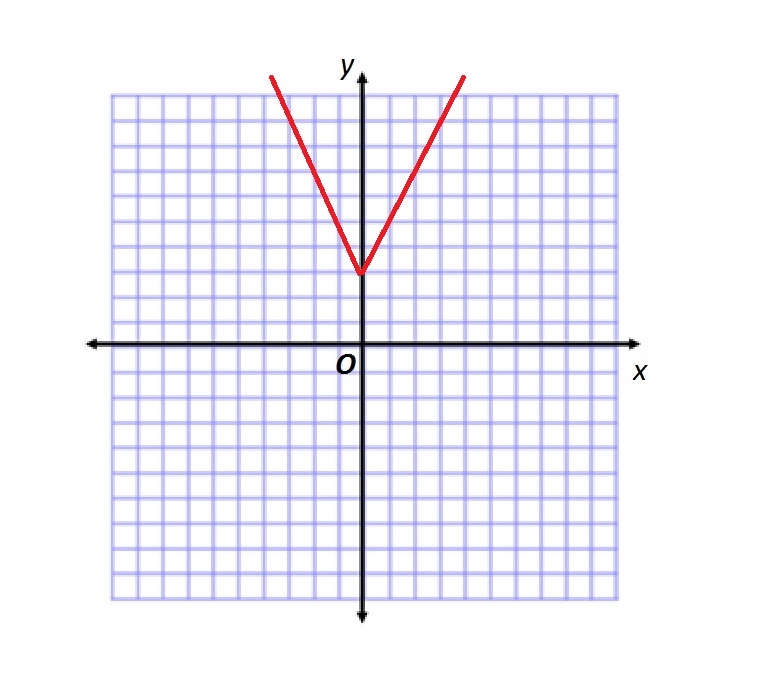
Example Question #2 : Transformations
Refer to the above figure.
Which of the following functions is graphed?
 = |3x-12|")
 = |3x+12|")
 =\left | \frac{1}{3} x-\frac{4}{3} \right |")
 =- |3x+12|")
 =\left | \frac{1}{3} x+\frac{4}{3} \right |")
Below is the graph of
If the graph of 
")
")
 = 3f(x)")
is formed. If the graph is then shifted right by four units, the new graph is
 = 3f(x- 4)")
Since the starting graph was
 = 3 |x-4|")
 = |3x-12|")
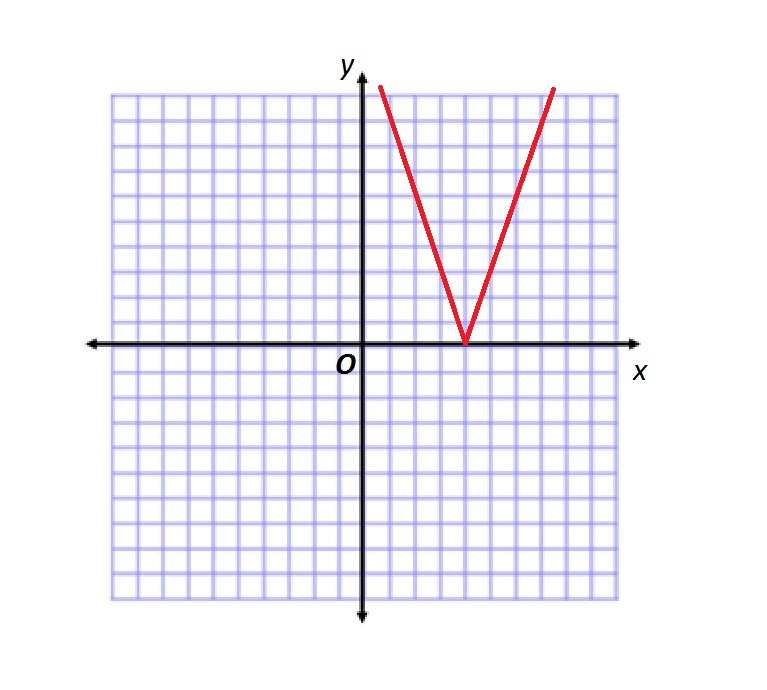
Example Question #3 : Transformations
Refer to the above figure.
Which of the following functions is graphed?
 =\left | \frac{1}{4}x-1 \right |")
 =\left | \frac{1}{4}x \right |- 4")
 =-|4x |- 4")
 =-|4x+16|")
 =\left | \frac{1}{4}x+1 \right |")
Below is the graph of
If the graph of 
")
")
 = \frac{1}{4}f(x)")
is formed. If the graph is then shifted down by four units, the new graph is
 = \frac{1}{4}f(x)- 4")
Since the starting graph was
 = \frac{1}{4}|x|- 4")
 =\left | \frac{1}{4}x \right |- 4")
Example Question #2 : Transformations
Refer to the above figure.
Which of the following functions is graphed?
 = |3x-6|")
 =\left | \frac{1}{3} x+ \frac{2}{3} \right |")
 =\left | \frac{1}{3} x- \frac{2}{3} \right |")
 = |3x|-2")
 =\left | \frac{1}{3} x \right |+2")
Below is the graph of
If the graph of 
")
")
 = \frac{1}{3}f(x)")
is formed. If the graph is then shifted right by two units, the new graph is
 = \frac{1}{3}f(x-2)")
Since the starting graph was
 = \frac{1}{3} |x-2|")
 =\left | \frac{1}{3} x- \frac{2}{3} \right |")


Certified Tutor

All SAT II Math II Resources

