All SAT II Math II Resources
Example Questions
Example Question #71 : Functions And Graphs

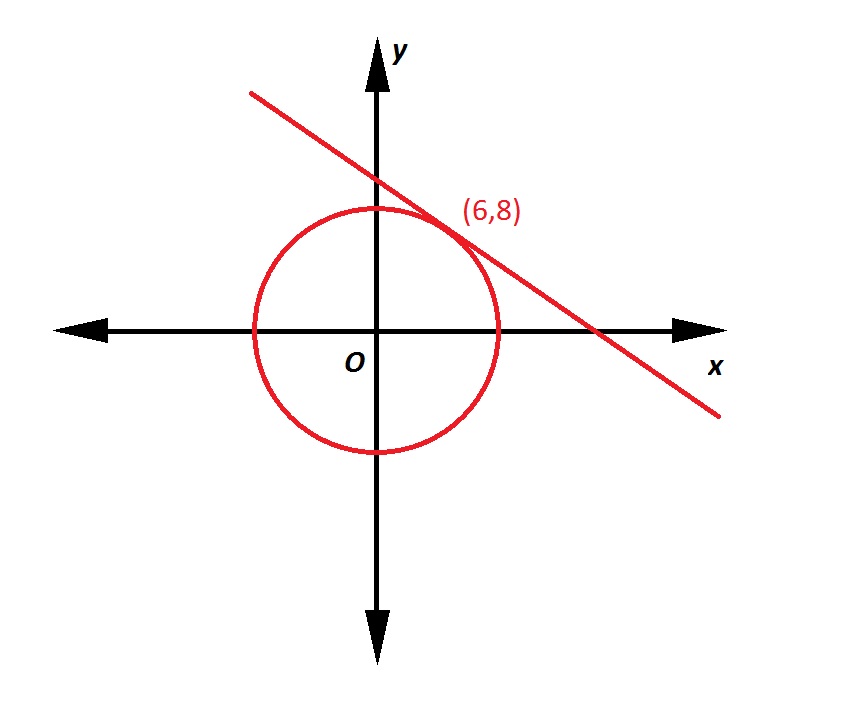
Note: Figure NOT drawn to scale.
Refer to the above figure. The circle has its center at the origin; the line is tangent to the circle at the point indicated. What is the equation of the line in slope-intercept form?
Insufficient information is given to determine the equation of the line.
A line tangent to a circle at a given point is perpendicular to the radius from the center to that point. That radius, which has endpoints 

The line, being perpendicular to this radius, will have slope equal to the opposite of the reciprocal of that of the radius. This slope will be 

Example Question #1 : Conic Sections
What is the center and radius of the circle indicated by the equation?
A circle is defined by an equation in the format 
The center is indicated by the point 

In the equation 


Example Question #1 : Graphing Quadratic Functions And Conic Sections
Give the axis of symmetry of the parabola of the equation
The line of symmetry of the parabola of the equation
is the vertical line
Substitute 
The line of symmetry is
That is, the line of the equation 
Example Question #3 : Graphing Functions
Give the 
The 
is

Substitute 
The 

Example Question #1 : Graphing Quadratic Functions And Conic Sections
A baseball is thrown straight up with an initial speed of 60 miles per hour by a man standing on the roof of a 100-foot high building. The height of the baseball in feet is modeled by the function
To the nearest foot, how high is the baseball when it reaches the highest point of its path?
We are seeking the value of 

To find this value, we first find the value of 

the 

Substitute 
The height of the baseball after 1.875 seconds will be

Example Question #5 : Graphing Functions
Give the 

The 
is

Set 
The 


Example Question #6 : Graphing Functions
A baseball is thrown upward from the top of a one hundred and fifty-foot-high building. The initial speed of the ball is forty-five miles per hour. The height of the ball after 
How high does the ball get (nearest foot)?
A quadratic function such as 
The vertex of a function
has as coordinates

The second coordinate is the height and we are looking for this quantity. Since 


The height of the ball at this point is 
Round this to 182 feet.
Example Question #7 : Graphing Functions
Give the 


The parabola has no 

Set 

The terms have a GCF of 2, so
The trinomial in parentheses can be FOILed out by noting that 

And you can divide both sides by 3 to get rid of the coefficient:
Set each of the linear binomials to 0 and solve for 
or
The parabola has as its two intercepts the points 

Example Question #1 : Graphing Trigonometric Functions
Give the amplitude of the graph of the function
The amplitude of the graph of a sine function 


Example Question #1 : Graphing Functions
Which of these functions has a graph with amplitude 4?
The functions in each of the choices take the form of a cosine function

The graph of a cosine function in this form has amplitude 

matches this description.
Certified Tutor
Certified Tutor
All SAT II Math II Resources


