SAT II Math I : Graphing Functions
Study concepts, example questions & explanations for SAT II Math I


All SAT II Math I Resources
Example Questions
Example Question #1 : Graphing Linear Functions
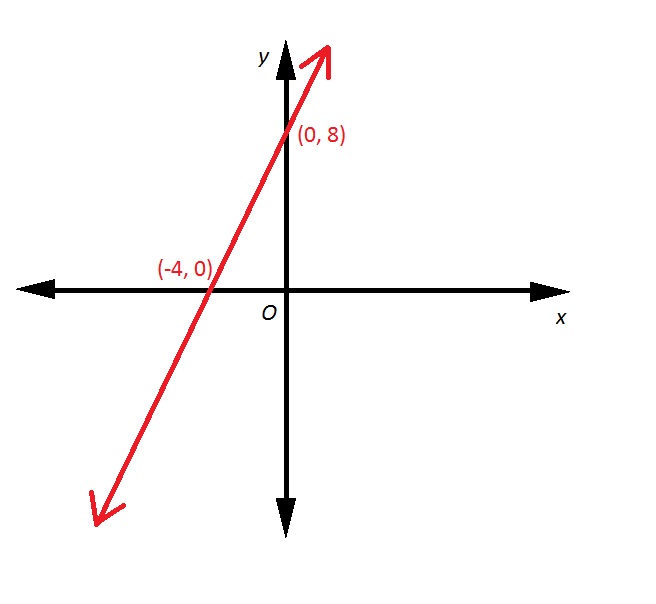
Refer to the above red line. A line is drawn perpendicular to that line, and with the same 


First, we need to find the slope of the above line.
The slope of a line. given two points , (x_{2}, y_{2})")

Set 
} = \frac{8}{4} = 2")
The slope of a line perpendicular to it has as its slope the opposite of the reciprocal of 2, which would be 

")


Example Question #2 : Graphing Functions
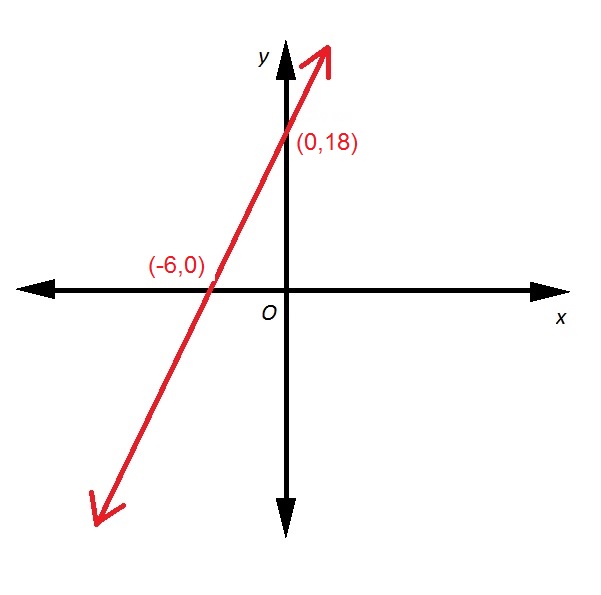
Refer to the above diagram. If the red line passes through the point ")


One way to answer this is to first find the equation of the line.
The slope of a line. given two points , (x_{2}, y_{2})")

Set 
} = \frac{18}{6} = 3")
The line has slope 3 and 
")


Now substitute 4 for 


Example Question #1 : Graphing Linear Functions
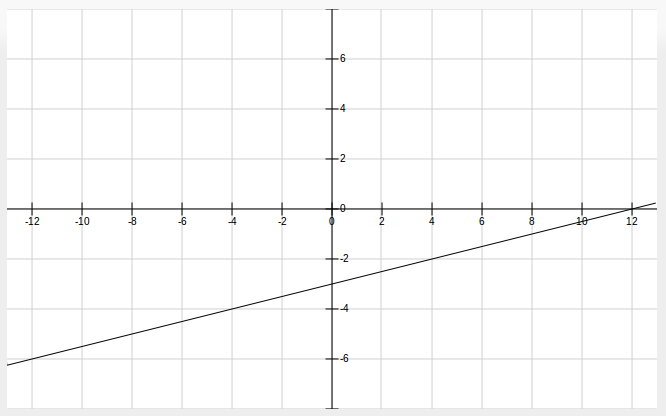
Which equation best matches the graph of the line shown above?
")
")
")
")
To find an equation of a line, we will always need to know the slope of that line -- and to find the slope, we need at least two points. It looks like we have (0, -3) and (12,0), which we'll call point 1 and point 2, respectively.
}{12-0}=\frac{3}{12}=\frac{1}{4}")
Now we need to plug in a point on the line into an equation for a line. We can use either slope-intercept form or point-slope form, but since the answer choices are in point-slope form, let's use that.
")
")
Unfortunately, that's not one of the answer choices. That's because we didn't pick the same point to substitute into our equation as the answer choices did. But we can see if any of the answer choices are equivalent to what we found. Our equation is equal to:

which is the slope-intercept form of the line. We have to put all the other answer choices into slope-intercept to see if they match. The only one that works is this one:
")
-2")


Example Question #3 : Graphing Functions
Determine where the graphs of the following equations will intersect.


")
")
")
")
We can solve the system of equations using the substitution method.


Solve for 


Substitute this value of 
+2y=-1")
Now we can solve for 


Solve for 

=-1")


The solution is the ordered pair ")
Example Question #121 : Functions And Graphs

Refer to the line in the above diagram. It we were to continue to draw it so that it intersects the 

")
")
")
")
")
First, we need to find the slope of the line.
In order to move from the lower left point to the upper right point, it is necessary to move up five units and right three units. This is a rise of 5 and a run of 3. makes the slope of the line shown 
We can use this to find the 
")
The lower left point has coordinates ")


= \frac{5}{3}\cdot (-2)")


Example Question #121 : Functions And Graphs
Line 
")
")

")
")
Insufficient information is given to answer this question.
The lines are distinct but neither parallel nor perpendicular.
The lines are parallel.
The lines are identical.
The lines are perpendicular.
The lines are parallel.
We calculate the slopes of the lines using the slope formula.
The slope of line 
} = \frac{0}{10} =0")
The slope of line 
}{8 - 5} = \frac{0}{3} =0")
The lines have the same slope, making them either parallel or identical.
Since the slope of each line is 0, both lines are horizontal, and the equation of each takes the form 


Example Question #1 : Graphing Linear Functions

Refer to the above diagram. which of the following compound inequality statements has this set of points as its graph?


A horizontal line has equation 


A vertical line has equation 


Since only the region belonging to both sets is shaded - that is, their intersection is shaded - the statements are connected with "and". The correct choice is 
Example Question #122 : Functions And Graphs

Which of the following inequalities is graphed above?


First, we determine the equation of the boundary line. This line includes points ")
")

Since we also know the 
")


The boundary is included, as is indicated by the line being solid, so the equality symbol is replaced by either 

")


0 is less than 3 so the correct symbol is 
The inequality is 
Example Question #5 : Graphing Functions
Select the equation of the line perpendicular to the graph of 


None of these.


Lines are perpendicular when their slopes are the negative recicprocals of each other such as 

Subtract the x variable from both sides:

Divide by 4 to isolate y:

The negative reciprocal of the above slope: 

Example Question #6 : Graphing Functions
An individual's maximum heart rate can be found by subtracting his or her age from 


In 

We are looking for a graph with a slope of -1 and a y-intercept of 220.
The slope is -1 because as you grow one year older, your maximum heart rate decreases by 1.

Certified Tutor

Certified Tutor

All SAT II Math I Resources

