SAT II Math I : Graphing Functions
Study concepts, example questions & explanations for SAT II Math I


All SAT II Math I Resources
Example Questions
Example Question #10 : Graphing Quadratic Functions
How many points of intersection could two distinct quadratic functions have?


An intersection of two functions is a point they share in common. A diagram can show all the possible solutions:

Notice that:
")
")

")
")

")
")

The diagram shows that 


Example Question #1 : Graphing Parabolas
Which of the following graphs matches the function ^2-2")
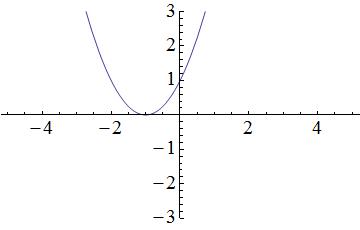
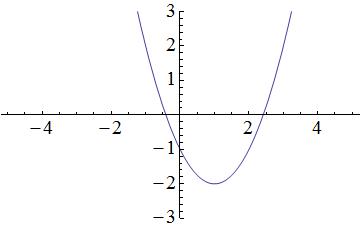
Start by visualizing the graph associated with the function 
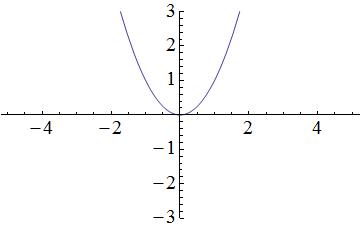
Terms within the parentheses associated with the squared x-variable will shift the parabola horizontally, while terms outside of the parentheses will shift the parabola vertically. In the provided equation, 2 is located outside of the parentheses and is subtracted from the terms located within the parentheses; therefore, the parabola in the graph will shift down by 2 units. A simplified graph of 
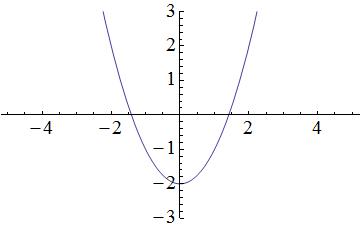
Remember that there is also a term within the parentheses. Within the parentheses, 1 is subtracted from the x-variable; thus, the parabola in the graph will shift to the right by 1 unit. As a result, the following graph matches the given function ^2-2")
Example Question #21 : Graphing Functions
Simplify the following expression:


To simplify, we must first simplify the absolute values.

Now, combine like terms:

Example Question #22 : Graphing Functions
=5x^{5}-3x^{2}+7")
Where does ")

5
7
-7
-3
3
7
")


=5x^{5}-3x^{2}+7")
=5(0)^{5}-3(0)^{2}+7")
=7")
Example Question #142 : Functions And Graphs
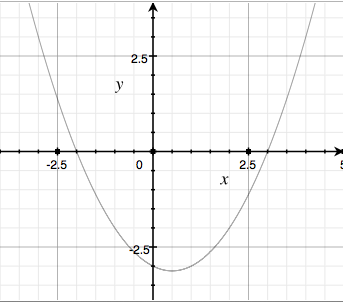
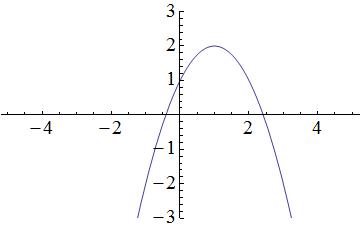
Which of the following is an equation for the above parabola?
(x+3)")
(x-2)")
(x+2)")
(x+2)")
The zeros of the parabola are at 

(x-z_{2})")
each of their signs is reversed to end up with the correct sign in the answer. The coefficient can be found by plugging in any easily-identifiable, non-zero point to the above formula. For example, we can plug in ")
(4+2)")


Example Question #422 : Sat Subject Test In Math I
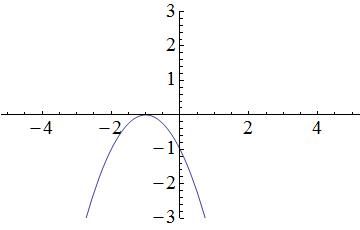
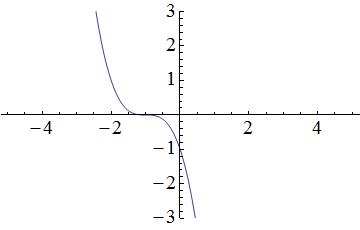
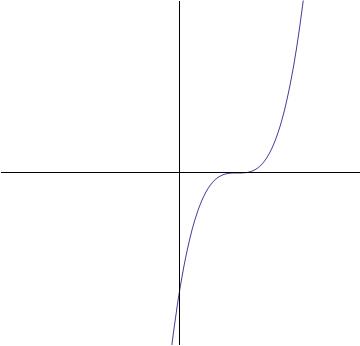
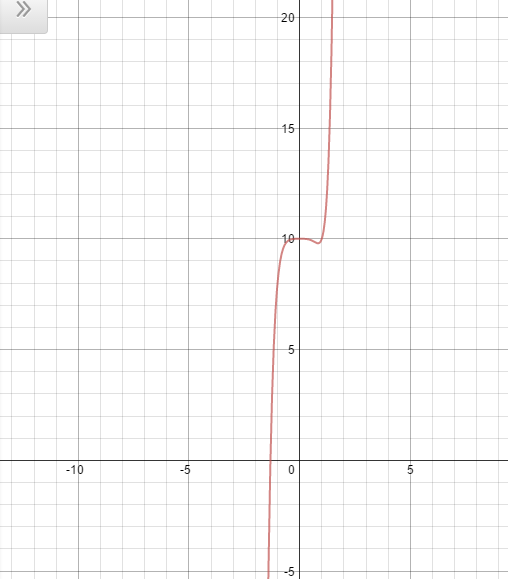
Which equation best represents the following graph?
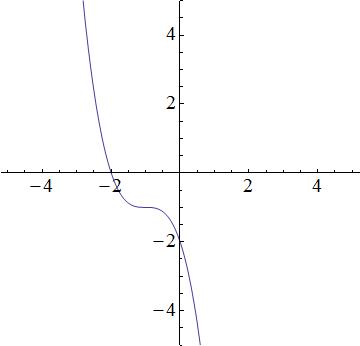
None of these
=-x-1")
=e^{2x-1}+\frac{1}{9}")
=-(x+1)^3-1")
=-(x+1)^2-1")
We have the following answer choices.
=-(x + 1)^3 - 1")
=-(x + 1)^2 - 1")
=-x - 1")
=e^{2x-1}+\frac{1}{9}")
The first equation is a cubic function, which produces a function similar to the graph. The second equation is quadratic and thus, a parabola. The graph does not look like a prabola, so the 2nd equation will be incorrect. The third equation describes a line, but the graph is not linear; the third equation is incorrect. The fourth equation is incorrect because it is an exponential, and the graph is not an exponential. So that leaves the first equation as the best possible choice.
Example Question #1 : Understand Linear And Nonlinear Functions: Ccss.Math.Content.8.F.A.3
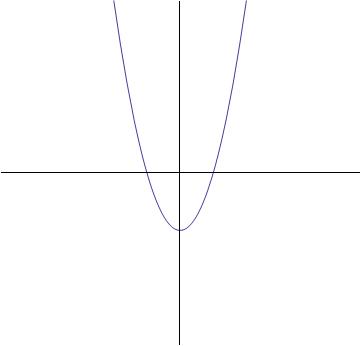
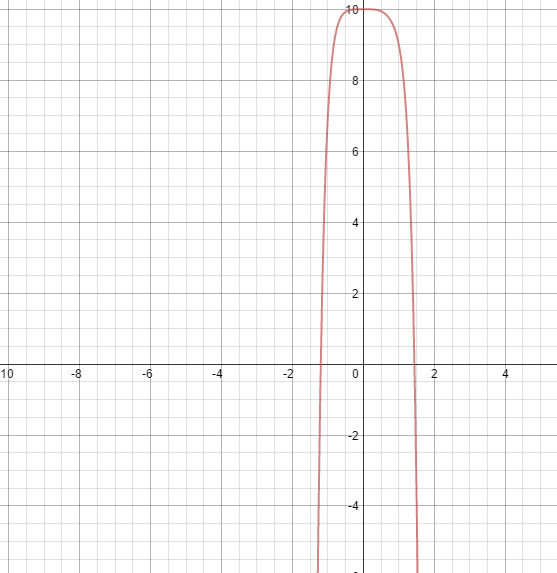
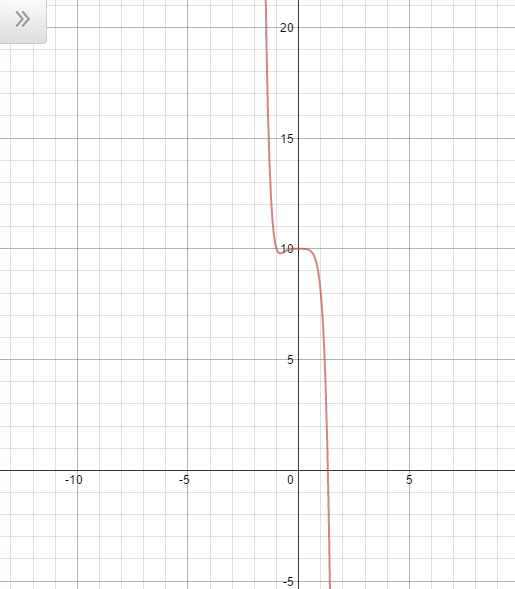
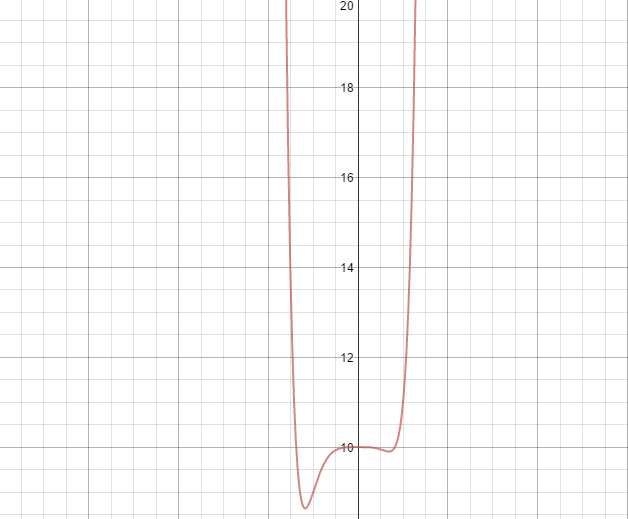
Which of the graphs best represents the following function?
=\frac{9}{10}x^2-7x+2")
None of these
=\frac{9}{10}x^2-7x+2")
The highest exponent of the variable term is two (
The graph below will be the answer, as it shows a parabolic curve.
Example Question #1 : Graphing Polynomial Functions
Which of the following is a graph for the following equation:

Cannot be determined
The way to figure out this problem is by understanding behavior of polynomials.
The sign that occurs before the 
Example Question #22 : Graphing Functions
Define a function  = x^{5}+ 4x^{2}")
 = 7")

")
Which of the following statements is correct about 
")
")
")
")
")
Define = f(x) - 7 = x^{5}+ 4x^{2} -7")
= f(c) - 7 = 0")
 = 7")
By the Intermediate Value Theorem (IVT), if ")
")
")
 = 0")
")
")
Evaluate ")

 = 1.0^{5}+ 4 \cdot 1.0^{2} -7 = -2")
 = 1.1^{5}+ 4 \cdot 1.1^{2} -7 \approx -0.55")
 = 1.2^{5}+ 4 \cdot 1.2^{2} -7 \approx 1.24")
 = 1.3^{5}+ 4 \cdot 1.3^{2} -7 \approx 3.47")
 = 1.4^{5}+ 4 \cdot 1.4^{2} -7 \approx 6.22")
 = 1.5^{5}+ 4 \cdot 1.5^{2} -7 \approx 9.59")
Only in the case of ")
")
 < 0 < g(1.2)")
 = 0")
 = 7")
")

Certified Tutor

Certified Tutor

All SAT II Math I Resources

