PSAT Math : Graphing

Study concepts, example questions & explanations for PSAT Math

varsity tutors app store varsity tutors android store

Example Questions

Example Question #52 : Graphing

A line graphed on the coordinate plane below. Graph_of_y_-2x_4

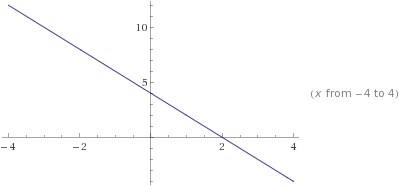
Give the equation of the line in slope intercept form. 

Possible Answers:

\dpi{100} \small y=-2x-4\(\displaystyle \dpi{100} \small y=-2x-4\)

\dpi{100} \small y=-x+4\(\displaystyle \dpi{100} \small y=-x+4\)

\dpi{100} \small y=2x-4\(\displaystyle \dpi{100} \small y=2x-4\)

\dpi{100} \small y=-2x+4\(\displaystyle \dpi{100} \small y=-2x+4\)

\dpi{100} \small y=2x+4\(\displaystyle \dpi{100} \small y=2x+4\)

Correct answer:

\dpi{100} \small y=-2x+4\(\displaystyle \dpi{100} \small y=-2x+4\)

Explanation:

The slope of the line is \dpi{100} \small -2\(\displaystyle \dpi{100} \small -2\) and the y-intercept is \dpi{100} \small 4\(\displaystyle \dpi{100} \small 4\).

The equation of the line is \dpi{100} \small y=-2x+4\(\displaystyle \dpi{100} \small y=-2x+4\)

Example Question #2 : Graphing

Graph_of_y_-x_3

Give the equation of the curve. 

Possible Answers:

None of the other answers

\dpi{100} \small y=x^{4}\(\displaystyle \dpi{100} \small y=x^{4}\)

\dpi{100} \small y=x^{3}\(\displaystyle \dpi{100} \small y=x^{3}\)

\dpi{100} \small y=-x^{3}\(\displaystyle \dpi{100} \small y=-x^{3}\)

\dpi{100} \small y=-x^{2}\(\displaystyle \dpi{100} \small y=-x^{2}\)

Correct answer:

\dpi{100} \small y=-x^{3}\(\displaystyle \dpi{100} \small y=-x^{3}\)

Explanation:

Graph_of_x_3This is the parent graph of \dpi{100} \small x^{3}\(\displaystyle \dpi{100} \small x^{3}\). Since the graph in question is negative, then we flip the quadrants in which it will approach infinity. So the graph of \dpi{100} \small y=-x^{3}\(\displaystyle \dpi{100} \small y=-x^{3}\) will start in quadrant 2 and end in 4. 

Example Question #1 : Graphing

The equation \(\displaystyle 3x + 2y = 6\) represents a line.  This line does NOT pass through which of the four quadrants?

Possible Answers:

IV

Cannot be determined

II

III

I

Correct answer:

III

Explanation:

Plug in \(\displaystyle 0\) for \(\displaystyle x\) to find a point on the line:

\(\displaystyle 3(0) + 2y = 6\)

\(\displaystyle y = 3\)

Thus, \(\displaystyle (0,3)\) is a point on the line.

Plug in \(\displaystyle 0\)  for \(\displaystyle y\) to find a second point on the line:

\(\displaystyle 3x + 2(0) = 6\)

\(\displaystyle x = 2\)

\(\displaystyle (2,0)\) is another point on the line.

Now we know that the line passes through the points \(\displaystyle (2,0)\) and \(\displaystyle (0,3)\).  

A quick sketch of the two points reveals that the line passes through all but the third quadrant.

Example Question #1 : Graphing


Psat1question

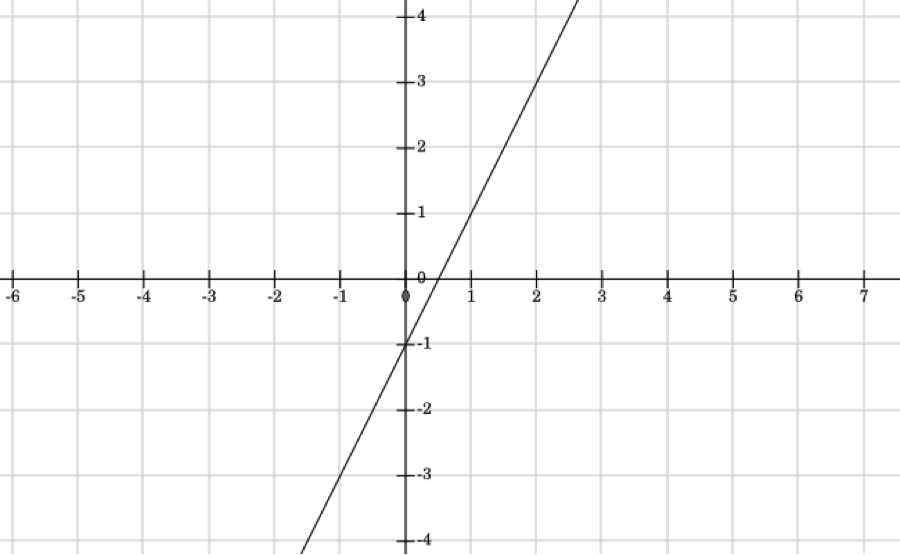
What is the equation of the line in the graph above?

Possible Answers:

\(\displaystyle y = 2x-1\)

\(\displaystyle y = 2x +1\)

\(\displaystyle y = x + 2\)

\(\displaystyle y=x-1\)

\(\displaystyle y = x + 1\)

Correct answer:

\(\displaystyle y = 2x-1\)

Explanation:

In order to find the equation of a line in slope-intercept form \(\displaystyle \left( y = mx+b\), where \(\displaystyle m\) is the slope and \(\displaystyle b\) is the y-intercept), one must know or otherwise figure out the slope of the line (its rate of change) and the point at which it intersects the y-axis. By looking at the graph, you can see that the line crosses the y-axis at \(\displaystyle y=-1\).  Therefore, \(\displaystyle b=-1\).

Slope is the rate of change of a line, which can be calculated by figuring out the change in y divided by the change in x, using the formula 

\(\displaystyle m = \frac{\Delta y}{\Delta x} = \frac{y_{2}-y_{1}}{x_{2}-x_{1}}\).  

When looking at a graph, you can pick two points on a graph and substitute their x-  and y-values into that equation.  On this graph, it's easier to choose points like \(\displaystyle (0,-1)\) and \(\displaystyle (1,1)\).  Plug them into the equation, and you get 

\(\displaystyle m = \frac{1+1}{1-0} = \frac{2}{1} = 2\)

Plugging in those values for \(\displaystyle m\) and \(\displaystyle b\) in the equation, and you get \(\displaystyle y=2x-1\)

Example Question #1 : How To Graph A Line

What are the x- and y- intercepts of the equation \(\displaystyle y = 4x -2\)?

Possible Answers:

\(\displaystyle \left ( 4,0\right )\ \textup{and}\ \left ( 0,-2\right )\)

\(\displaystyle \left ( -2,0\right )\ \textup{and}\ \left ( 0,\frac{1}{2}\right )\)

\(\displaystyle \left ( \frac{1}{2},0 \right )\textup{and}\left ( 0,-2\right )\)

\(\displaystyle \left ( -2,0\right )\ \textup{and}\left ( 0,-4\right )\)

\(\displaystyle \left ( -2,0\right )\ \textup{and}\ \left ( 0,4\right )\)

Correct answer:

\(\displaystyle \left ( \frac{1}{2},0 \right )\textup{and}\left ( 0,-2\right )\)

Explanation:

Answer: (1/2,0) and (0,-2)

Finding the y-intercept: The y-intercept is the point at which the line crosses tye y-axis, meaning that x = 0 and the format of the ordered pair is (0,y) with y being the y-intercept.  The equation \(\displaystyle y=4x-2\) is in slope-intercept (\(\displaystyle y=mx+b\)) form, meaning that the y-intercept, b, is actually given in the equation.  b = -2, which means that our y-intercept is -2.  The ordered pair for expressing this is (0,-2)

Finding the x-intercept: To find the x-intercept of the equation \(\displaystyle y=4x-2\), we must find the point where the line of the equation crosses the x-axis.  In other words, we must find the point on the line where y is equal to 0, as it is when crossing the x-axis.  Therefore, substitute 0 into the equation and solve for x: \(\displaystyle 0=4x-2\)

\(\displaystyle 2 = 4x\)

\(\displaystyle 1/2=x\)

The x-interecept is therefore (1/2,0).  

Example Question #2 : Graphing

Which of the following could be the equation of the line shown in this graph?

Line

Possible Answers:

\(\displaystyle y=\frac{4}{3}x -5\)

\(\displaystyle y=-\frac{5}{7}x -1\)

\(\displaystyle y=-\frac{2}{3}x +1\)

\(\displaystyle y=-\frac{7}{6}x -4\)

\(\displaystyle y=\frac{2}{3}x +2\)

Correct answer:

\(\displaystyle y=-\frac{2}{3}x +1\)

Explanation:

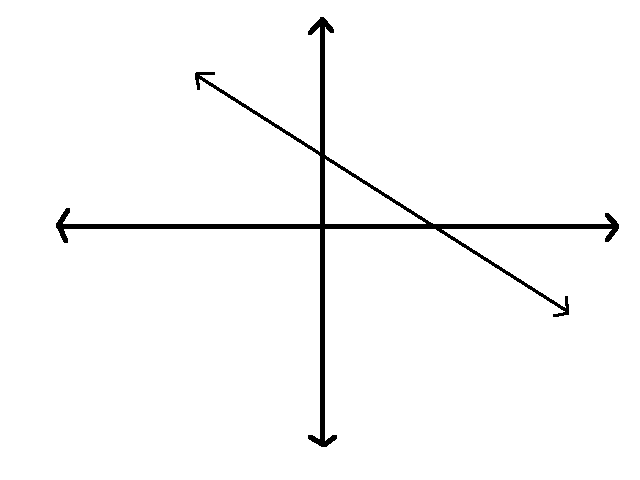
The line in the diagram has a negative slope and a positive y-intercept. It has a negative slope because the line moves from the upper left to the lower right, and it has a positive y-intercept because the line intercepts the y-axis above zero. 

The only answer choice with a negative slope and a positive y-intercept is 

\(\displaystyle y=-\frac{2}{3}x +1\)

Example Question #2 : Graphing

Which of the following coordinate pairs is farthest from the origin?

Possible Answers:

\(\displaystyle (2, 5)\)

\(\displaystyle (3, 4)\)

\(\displaystyle (-1, 8)\)

\(\displaystyle (0, 7)\)

\(\displaystyle (1, 6)\)

Correct answer:

\(\displaystyle (-1, 8)\)

Explanation:

Using the distance formula, calculate the distance from each of these points to the origin, (0, 0). While each answer choice has coordinates that add up to seven, (-1, 8) is the coordinate pair that produces the largest distance, namely \(\displaystyle \sqrt{65}\), or approximately 8.06.

Example Question #3 : Graphing

A point at \(\displaystyle \left ( -3,6\right )\) in the standard coordinate plane is shifted right 5 units and down 3 units.  What are the new coordinates of the point?

Possible Answers:

\(\displaystyle \left ( -5,-3\right )\)

\(\displaystyle \left ( -6,-12\right )\)

\(\displaystyle \left ( 0,0\right )\)

\(\displaystyle \left ( 5,3\right )\)

\(\displaystyle \left ( 2,3\right )\)

Correct answer:

\(\displaystyle \left ( 2,3\right )\)

Explanation:

The point \(\displaystyle \left ( -3,6\right )\) shifted to the right 5 units will shift along the x-axis, meaning that you will add 5 to the original x-coordinate, so the new \(\displaystyle x=2\). The point shifted down by three units will shift down the y-axis, meaning that you will subtract three from the original y-coordinate, so the new \(\displaystyle y=3\).

The resultant coordinate is \(\displaystyle \left ( 2,3\right )\).  

Example Question #1 : How To Graph A Point

Axes_1

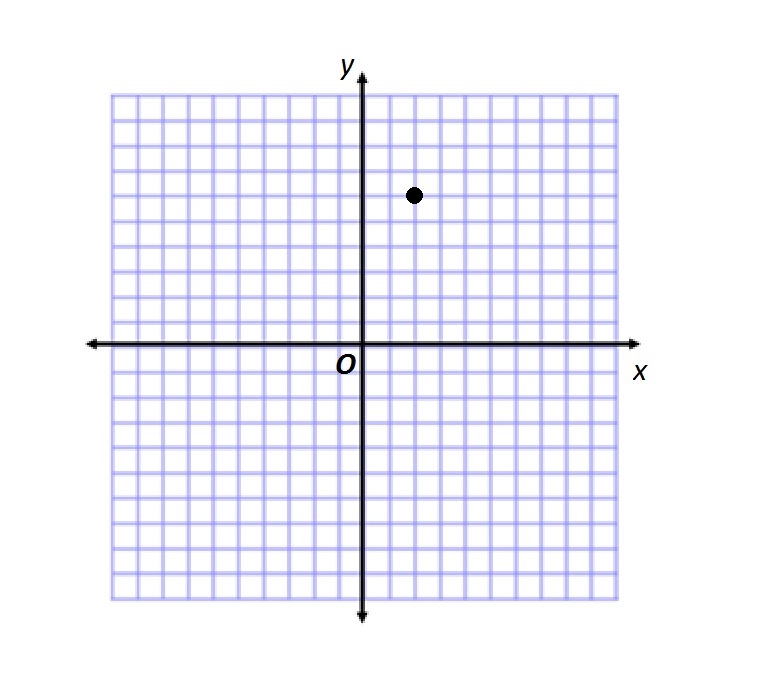
Give the coordinates of the point plotted in the above set of coordinate axes.

Possible Answers:

\(\displaystyle (2,-6)\)

\(\displaystyle (2,6)\)

\(\displaystyle (6, 2)\)

None of the other responses is correct.

\(\displaystyle (6, -2)\)

Correct answer:

\(\displaystyle (2,6)\)

Explanation:

The point can be reached from the origin by moving 2 units right then 6 units up. This makes the first coordinate 2 and the second coordinate 6.

Example Question #1 : How To Graph A Function

Which of the following could be a value of f(x)\(\displaystyle f(x)\) for f(x)=-x^2 + 3\(\displaystyle f(x)=-x^2 + 3\)?

Possible Answers:

5\(\displaystyle 5\)

6\(\displaystyle 6\)

4\(\displaystyle 4\)

7\(\displaystyle 7\)

3\(\displaystyle 3\)

Correct answer:

3\(\displaystyle 3\)

Explanation:

The graph is a down-opening parabola with a maximum of y=3\(\displaystyle y=3\). Therefore, there are no y values greater than this for this function.

Learning Tools by Varsity Tutors