MAP 8th Grade Math : Statistics and Probability
Study concepts, example questions & explanations for MAP 8th Grade Math


All MAP 8th Grade Math Resources
Example Questions
Example Question #1 : Statistics And Probability
The scatter plot provided displays a group of students' test scores versus the number of missing assignments the students have. Based on plot, select the best answer that describes the direction of the points.

A positive, nonlinear association
A negative, linear association
A negative, non linear association
A positive, linear association
A negative, linear association
The data points in the scatter plot move up the y-axis as the x-axis decreases; thus the data points show a negative association. Also, the data points do not curve, or go up and down, but gradually decreased; thus the scatter plot shows a linear association. We could even draw a "best fit" line:

Example Question #2 : Statistics And Probability
Select the answer choice with a data set that includes an outlier.


To answer this question correctly, we need to recall what "outlier" means. An outlier is a value that is much smaller or larger than the rest of the values in a set of data. Also, a data point that does not follow the same pattern as the rest of the set could be described as an outlier.
In this case, we are looking for a number that doesn't match with the other numbers provided in a set:


Example Question #3 : Statistics And Probability
A middle school teacher conducted a survey of the 


To help answer this question, we can construct a two-way table and fill in our known quantities from the question.
The columns of the table will represent the students who are athletes or are not athletes and the rows will contain the students who drink soda or do not drink soda. The first bit of information that we were given from the question was that 


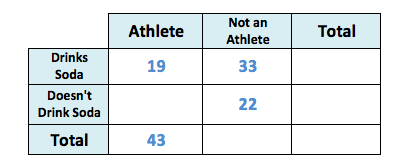
Our question asked how many students don't drink soda. We add up the numbers in the "doesn't drink soda" row to get the total, but first we need to fill in a gap in our table, students who were athletes, but don't drink soda. We can take the total number of students who are athletes, 


This means that 
Now, we add up the numbers in the "doesn't drink soda" row to get the total:

This means that 

Certified Tutor

Certified Tutor

All MAP 8th Grade Math Resources

