ISEE Upper Level Quantitative : How to find the answer from a table
Study concepts, example questions & explanations for ISEE Upper Level Quantitative


All ISEE Upper Level Quantitative Resources
Example Questions
Example Question #51 : Tables
One ordinary six-sided die is altered such that the probability of tossing a six on that die is 

Which of the following is the greater quantity?
(a) The probability that the roll of two fair dice will come up a total of 2
(b) The probability that the roll of the two altered dice will come up a total of 2
(a) and (b) are equal
(a) is the greater quantity
(b) is the greater quantity
It cannot be determined which of (a) and (b) is greater
(a) is the greater quantity
There is only one way that the roll of two dice can come up 2 - for both dice to come up a one.
The probability of a fair die coming up a one is 

The probability of a "1" coming up on the first altered die is
 = \frac{1}{5} \cdot \frac{3}{4}= \frac{3}{20}")
The probability of a "1" coming up on the second altered die is
 = \frac{1}{5} \cdot \frac{7}{8}= \frac{7}{40}")
Therefore, the probability of a roll of double one on the altered dice is

Therefore, "2" is more likely to come up on the fair dice.
Example Question #51 : Tables
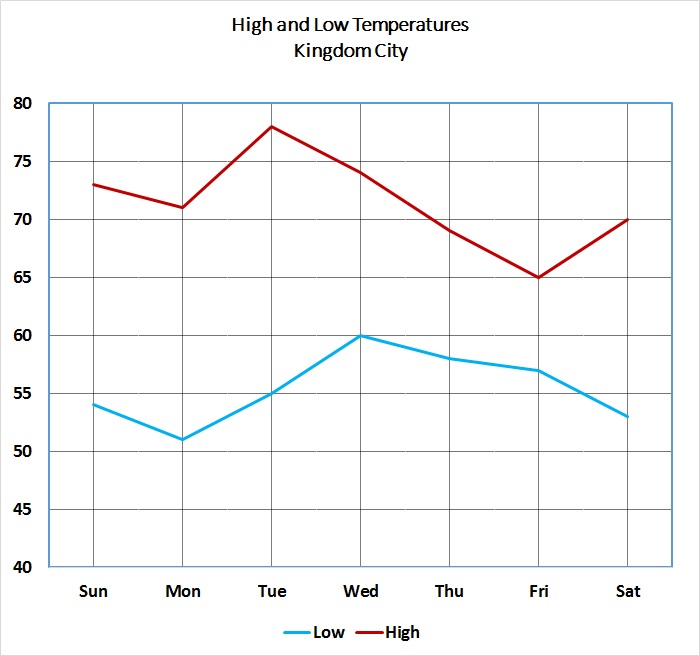
Refer to the above graph, which shows the high and low temperatures for Kingdom City over a one-week period.
Which is the greater quantity?
(a) The temperature in Kingdom City at 6 AM Wednesday
(b) The temperature in Kingdom City at 6 PM Wednesday
(a) and (b) are equal
It is impossible to determine which is greater from the information given
(b) is the greater quantity
(a) is the greater quantity
It is impossible to determine which is greater from the information given
The line graph only indicates the high and low temperatures for the individual days; it says nothing about the temperature at any specific time of any day. Therefore, the question cannot be answered from the graph alone.
Example Question #52 : Tables
Refer to the above graph, which shows the high and low temperatures for Kingdom City over a one-week period.
Which is the greater quantity?
(a) The lowest high temperature for any of the seven days
(b) The highest low temperature for any of the seven days
It is impossible to determine which is greater from the information given
(a) is the greater quantity
(b) is the greater quantity
(a) and (b) are equal
(a) is the greater quantity
Examine the low point of the line representing the high temperatures and the high point of the line representing the low temperatures.
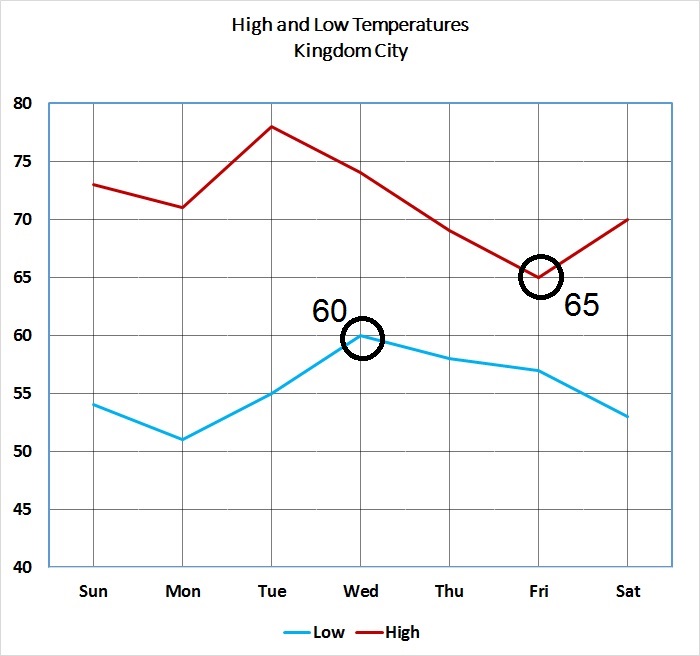
It can be seen that the lowest of the high temperatures is 65 degrees (Friday), and that the highest of the low temperatures is 60 degrees (Wednesday). This makes the former quantity the greater.
Example Question #53 : Tables
Refer to the above graph, which shows the high and low temperatures in degrees Fahrenheit for Kingdom City over a one-week period.
Which is the greater quantity?
(a) The temperature in Kingdom City at noon on Friday
(b) 70 degrees
(b) is the greater quantity
(a) and (b) are equal
(a) is the greater quantity
It is impossible to determine which is greater from the information given
(b) is the greater quantity
The graph does not tell us the temperatures at any specific time of day on any of the seven days. However, as seen below, we know from the graph that the high temperature on Friday was 65 degrees.
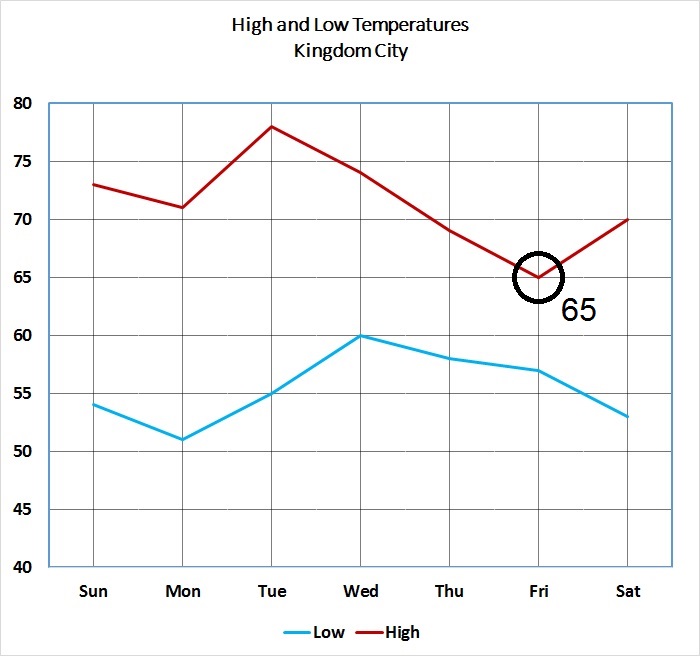
The temperature at noon Friday cannot have been greater than 65 degrees, so 70 is the greater quantity.
Example Question #64 : Data Analysis And Probability
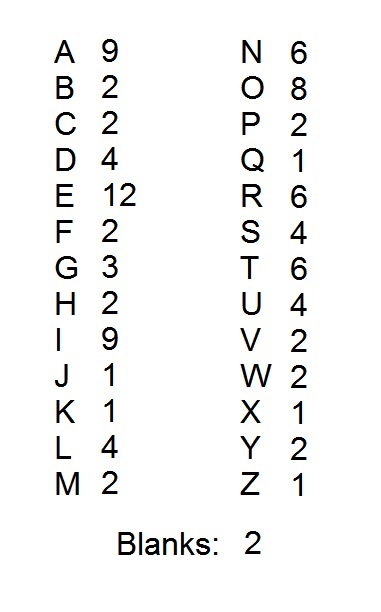
A popular word game uses one hundred tiles, each of which is marked with a letter or a blank. The distribution of the tiles is shown above, with each letter paired with the number of tiles marked with that letter. Notice that there are two blank tiles.
All of the tiles are put in a box except for the unique tiles and the blanks. A tile is drawn at random. Which is the greater quantity?
(a) The probability that the tile is a vowel
(b)

(Note: "Y" is considered a consonant here)
(a) and (b) are equal
It is impossible to determine which is greater from the information given
(b) is the greater quantity
(a) is the greater quantity
(b) is the greater quantity
There are five unique tiles - "J", "K", "Q", "X", and "Z" - and two blanks, for a total of 7 tiles not placed in the box. Therefore, the box contains 93 tiles.
The number of tiles with each vowel is as follows:
A: 9 tiles
E: 12 tiles
I: 9 tiles
O: 8 tiles
U: 4 tiles
This is a total of 


Example Question #71 : Data Analysis
A popular word game uses one hundred tiles, each of which is marked with a letter or a blank. The distribution of the tiles is shown above, with each letter paired with the number of tiles marked with that letter. Notice that there are two blank tiles.
All of the tiles are put in a box except for the unique tiles; they are replaced by five tiles from another set - one of each of the five vowels ("Y" is considered a consonant here). A tile is drawn at random. Which is the greater quantity?
(a) The probability that the tile is a consonant
(b)

(b) is the greater quantity
(a) and (b) are equal
It is impossible to determine which is greater from the information given
(a) is the greater quantity
(a) is the greater quantity
It is easier to count the tiles that are vowels or blanks than it is to count the tiles marked with consonants. Keeping in mind that one of each vowel has been added, the number of each vowel is as follows:
A: 10 tiles
E: 13 tiles
I: 10 tiles
O: 9 tiles
U: 5 tiles
Blanks: 2 tiles
Add these: 
Since the five unique tiles - "J", "K", "Q", "X", and "Z" - were replaced by five vowel tiles, the number of tiles remained constant at 100. Therefore, there are

consonant tiles; consonants therefore make up more than one half of the tiles, and the probability that a randomly drawn tile will be a consonant is greater than 
Example Question #551 : Isee Upper Level (Grades 9 12) Quantitative Reasoning
A popular word game uses 100 tiles, each of which is marked with a letter or a blank. The distribution of the tiles is shown above, with each letter paired with the number of tiles marked with that letter. Notice that there are two blank tiles.
All of the tiles are put in a box except for the unique tiles and the blanks. They are replaced by enough randomly selected tiles from a second set to bring the total of tiles back up to 100. Which is the greater quantity?
(a) The number of tiles in the box that are marked with consonants
(b) 50
(b) is the greater quantity
(a) is the greater quantity
(a) and (b) are equal
It is impossible to determine which is greater from the information given
(a) is the greater quantity
The number of tiles with each vowel is as follows:
A: 9 tiles
E: 12 tiles
I: 9 tiles
O: 8 tiles
U: 4 tiles
This is a total of 
 = 100- 44 = 56")
consonant tiles.
There are five unique tiles - "J", "K", "Q", "X", and "Z". Removing them leaves 
Example Question #73 : Data Analysis
The beverage menu from a coffeehouse reads as follows:

Eight friends go out for drinks. Three order cappuccino, two order espresso, one orders Americano, one orders Turkish coffee, and one orders cafe latte. One of the eight agrees to leave the entire amount of the tip, which is to be 20% of the check. How much will be the amount of the tip (round to the nearest dime)?


The costs of the beverages will be as follows:

Add these amounts:

20% of this is

Example Question #552 : Isee Upper Level (Grades 9 12) Quantitative Reasoning
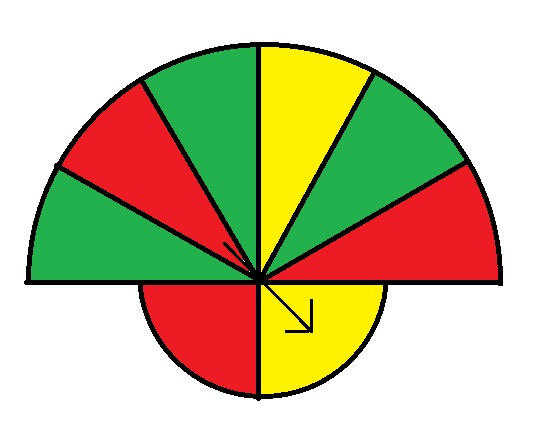
The above figure shows a spinner used in a game. The upper semicircle has twice the radius of the lower semicircle.
Which of the following is the greater quantity?
(a) The probability that a random spin will cause the spinner to land in a green region.
(b) The probability that a random spin will cause the spinner to land in a red region.
(b) is the greater quantity
(a) and (b) are equal
(a) is the greater quantity
It cannot be determined which of (a) and (b) is greater
(b) is the greater quantity
The size of the regions do not matter in this problem; it is the central angles of the sectors that are relevant. The best way to understand this is to look at the spinner again, but after cutting out the central circle:

If we rearrange the sectors, we see the following:
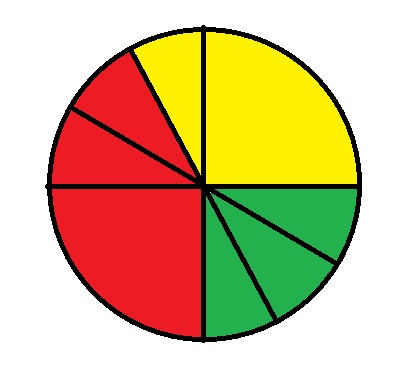
The probability of the spinner landing in red exceeds that of it landing in green.

Certified Tutor

Certified Tutor

All ISEE Upper Level Quantitative Resources

