All GED Social Studies Resources
Example Questions
Example Question #71 : Ged Social Studies
The following question refers to the information contained in this timeline.
Population of the United States
1800 5,236,631
1840 17,069, 453
1880 49,371,340
1920 106,021,568
1960 179,323,175
2000 281,421,906
data from the U.S. Census Bureau
The biggest percentage increase in population occurs from _______________.
1960 to 2000
1920 to 1960
1800 to 1840
1880 to 1920
1840 to 1880
1800 to 1840
This question asks you to figure out where the biggest percentage increase in population occurs, not the biggest jump in pure population numbers. The correct answer then is from 1800 to 1840. In this time period the population jumps more than 240%. The next highest is from 1840 to 1880, when the population jumps by 190%. Notice how the percentage of the population growth steadily declines even while the growth in pure population numbers continues to rise.
Example Question #72 : Ged Social Studies
The following question refers to the information contained in this table.
Life Expectancy (in years)
Japan 84.6
Spain 82.5
Norway 81.9
Ireland 81.4
United Kingdom 81
United States 79.8
Mexico 77.2
China 76
Colombia 74.7
Russia 70.5
Iraq 68.5
India 65
Ethiopia 60.5
Nigeria 53
Lesotho 51
Data provided by the World Health Organization (2012).
Based on this table, which of these statements is most accurate?
The United States has a lower life expectancy than Mexico
Warfare is the number one contributor to a country having a low life expectancy
People in Asia have a much higher life expectancy than the rest of the world
People in Africa have a much lower life expectancy than the rest of the world
People in Europe have a much higher life expectancy than the rest of the world
People in Africa have a much lower life expectancy than the rest of the world
All of the lowest figures in this chart are for African countries, so it is reasonable to conclude that people in Africa have a much lower life expectancy than the rest of the world. Because Japan is first, you might have been tempted to answer that people in Asia have a much higher life expectancy, but you are also shown that China and India are much lower in the table. Similarly, although many European nations appear near the top of the table, the fact that they are all surpassed by Japan tells you that Europe cannot be said to have a higher life expectancy than the rest of the world.
Example Question #73 : Ged Social Studies
The following question refers to the information contained in this timeline.
Ninth century Invention of gunpowder in China.
Tenth century Invention of fireworks in China.
1119 Invention of the compass in China.
1450 Invention of the mechanical moving-type printing press in Germany.
1876 Invention of the telephone in the United States.
1928 Penicillin discovered by Alexander Fleming.
1945 Completion of the Manhattan Project by the United States, Canada, and Britain.
A printed manuscript is found by a historian in France, it may have been printed no earlier than ________________.
1119
1450
1945
1928
The ninth century
1450
The movable-type printing press, invented in Germany about 1450, allowed books to be copied and printed by machine for the first time in European history. Before that, any book or manuscript had to be written and copied by hand; therefore, a printed manuscript found in France must date from later than 1450.
Example Question #74 : Ged Social Studies
The following question refers to the information contained in this timeline.
Population of the United States
1800 5,236,631
1840 17,069, 453
1880 49,371,340
1920 106,021,568
1960 179,323,175
2000 281,421,906
data from the U.S. Census Bureau
When did the United States population climb above 100 million for the first time?
Between 1920 and 1960
In the 1920s
In the 1910s
Between 1880 and 1920
In the 1880s
Between 1880 and 1920
Based on the data represented in the table, it is very probable that the population climbed above 100 million for the first time in the 1910s; however, you cannot reliably state that that is definitely true. All you know for sure is that the population was at 49 million in 1880 and 106 million in 1920 so the population must have climbed above 100 million between 1880 and 1920.
Example Question #75 : Ged Social Studies
The following question refers to the information contained in this timeline.
55 B.C.E. Julius Caesar successfully invades Britain.
43 C.E. Emperor Claudius makes Britain part of the Roman Empire.
122 C.E. Hadrian’s wall is built.
383 C.E. Roman Empire begins to withdraw from Britain.
449 C.E. The Saxons and Angles arrive in Britain.
730 C.E. The Venerable Bede produces his history of the British Isles.
790 C.E. Vikings begin raiding British coasts.
842 C.E. Vikings raid London.
1016 C.E. Cnut the Great becomes King of England.
1066 C.E. William, Duke of Normandy, invades England and is crowned King.
The information in this timeline supports the argument that __________.
the Romans were foolish to try and conquer the British Isles
the British Isles were subject to numerous waves of conquest and invasion in the first millennium of the common era
the Vikings were unable to establish complete control of the British Isles
the Normans reigned the longest in the British Isles
the Angles and Saxons were bloodthirsty people
the British Isles were subject to numerous waves of conquest and invasion in the first millennium of the common era
The only answer choice that this timeline definitely supports is the argument that the British Isles were subject to numerous waves of conquest and invasion. First the Romans, then the Saxons and Angles, then the Vikings, and then the Normans arrived on British shores in the time period shown. You cannot reasonably state that the Normans reigned the longest as you are not told when their dominion ends. You might be tempted to say that the Romans were foolish to try to conquer the British Isles, given that they had to withdraw their forces eventually, but this is revisionist history, and besides the use of the word "foolish" in a historical context is always dubious. There is no evidence to suggest that the Angles and Saxons were particularly bloodthirsty, nor is there any to suggest that the Vikings were unable to establish complete control of the British Isles.
Example Question #71 : Question Types

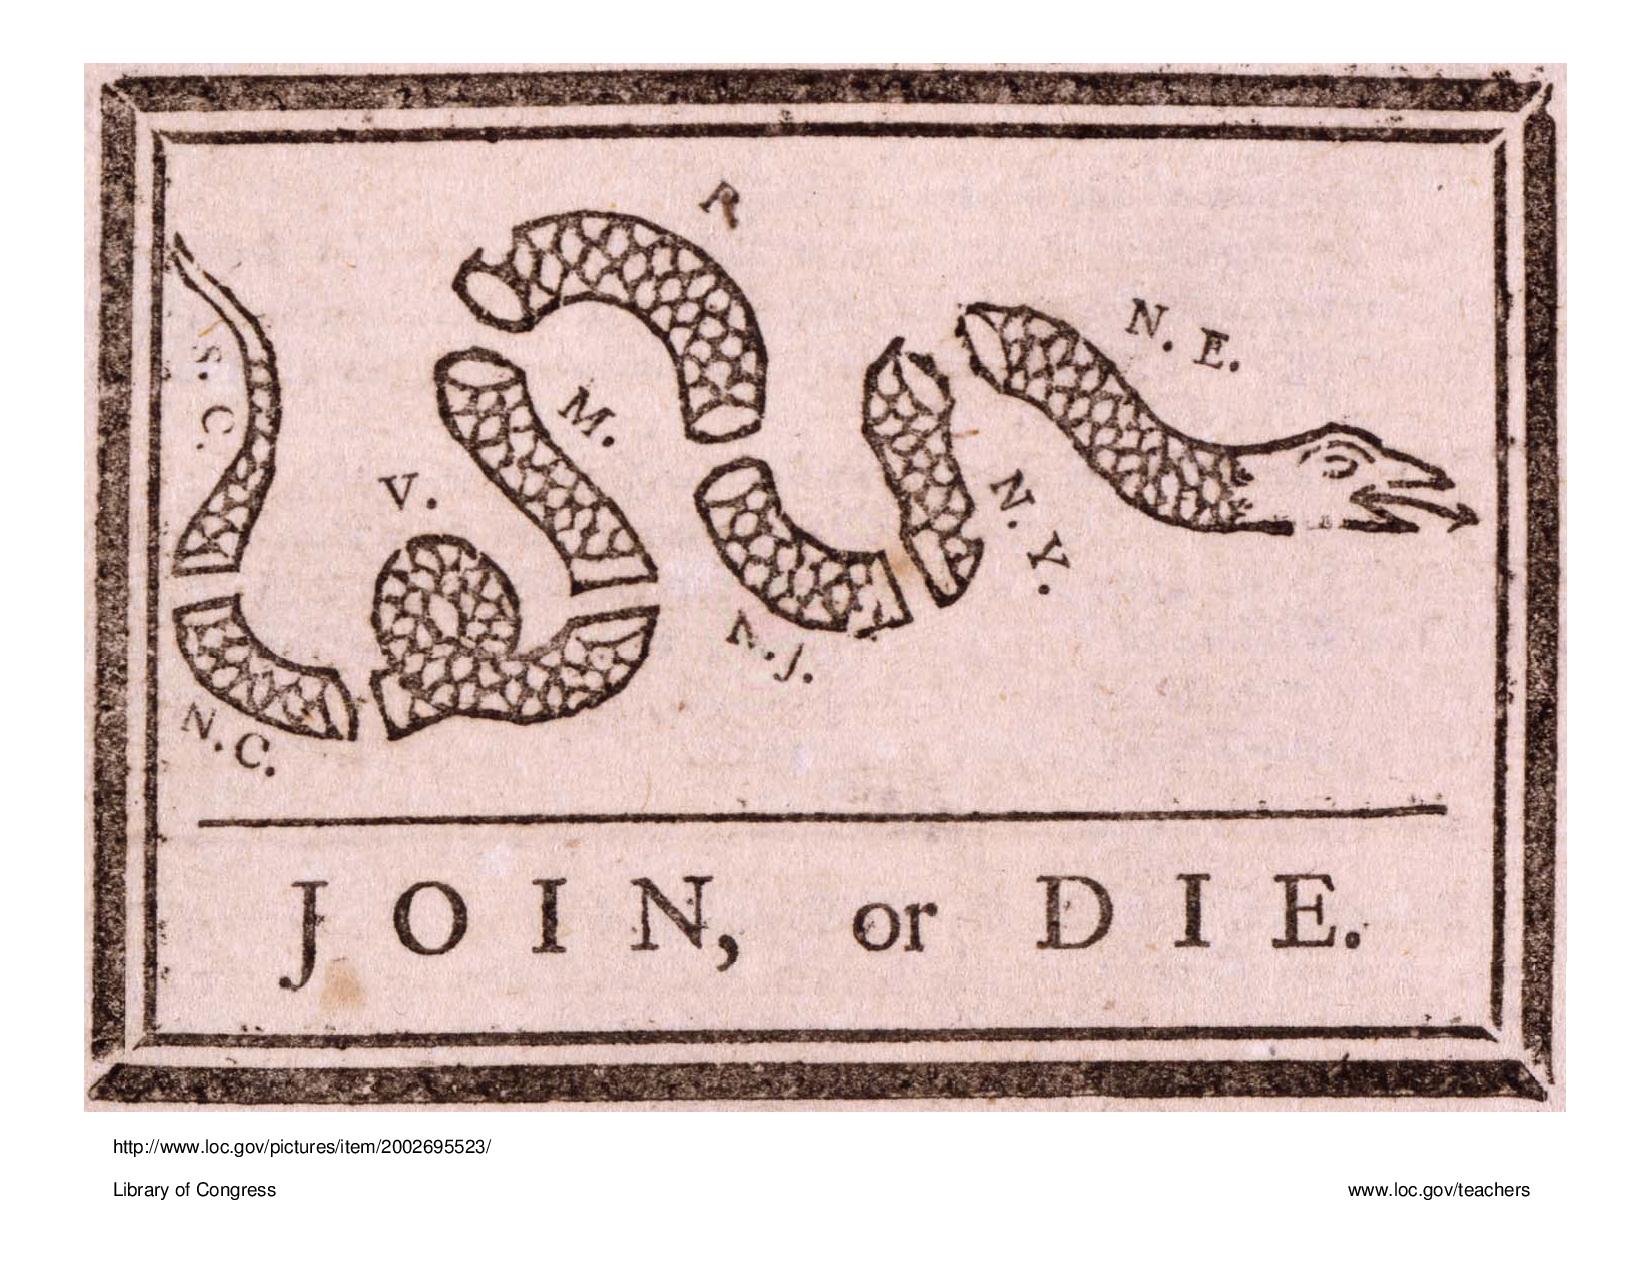
This cartoon is primarily urging __________
rebellion.
disloyalty.
aggression.
unity.
fear.
unity.
The cartoon is titled Join or die and shows a snake divided up into a series of segments. It is one of the oldest and most famous political cartoons in American history and was drawn by Benjamin Franklin to encourage the various colonies of America to join together to ensure their greater collective strength. It is therefore primarily urging unity.
Example Question #72 : Question Types

The different segments of the snake most likely represent __________
trade agreements.
political leaders.
the Colonies.
countries.
armies of the United States.
the Colonies.
Each of the segments of the snake is labelled. The fact that they are labelled as “NY,” “SC,” “NJ” etc. suggests that they are meant to represent the states; however, this is not an option you are given so you have to consider the fact that the cartoon was created during the colonial era when the states were not yet states, but colonies. The correct answer is therefore that the different segments of the snake represent the colonies.
Example Question #73 : Question Types

This cartoon was published during the French and Indian War and related to the Albany Plan of Union; based on the cartoon the author would most likely __________ the Albany Plan of Union?
criticize
encourage support for
lament
encourage rebellion against
mock and deride
encourage support for
The Albany Plan of Union was proposed by Benjamin Franklin at the Albany Congress in 1754. It took place during the French and Indian War. The Albany Plan of Union proposed to create a unified government for the thirteen colonies to provide for mutual defense and promotion of interests. Because the cartoon is titled "Join, or Die," and seems to show that a disunified body cannot survive, it is reasonable to suggest that the author of this cartoon would most likely encourage support for the Albany Plan of Union.
Example Question #1 : Political Cartoons

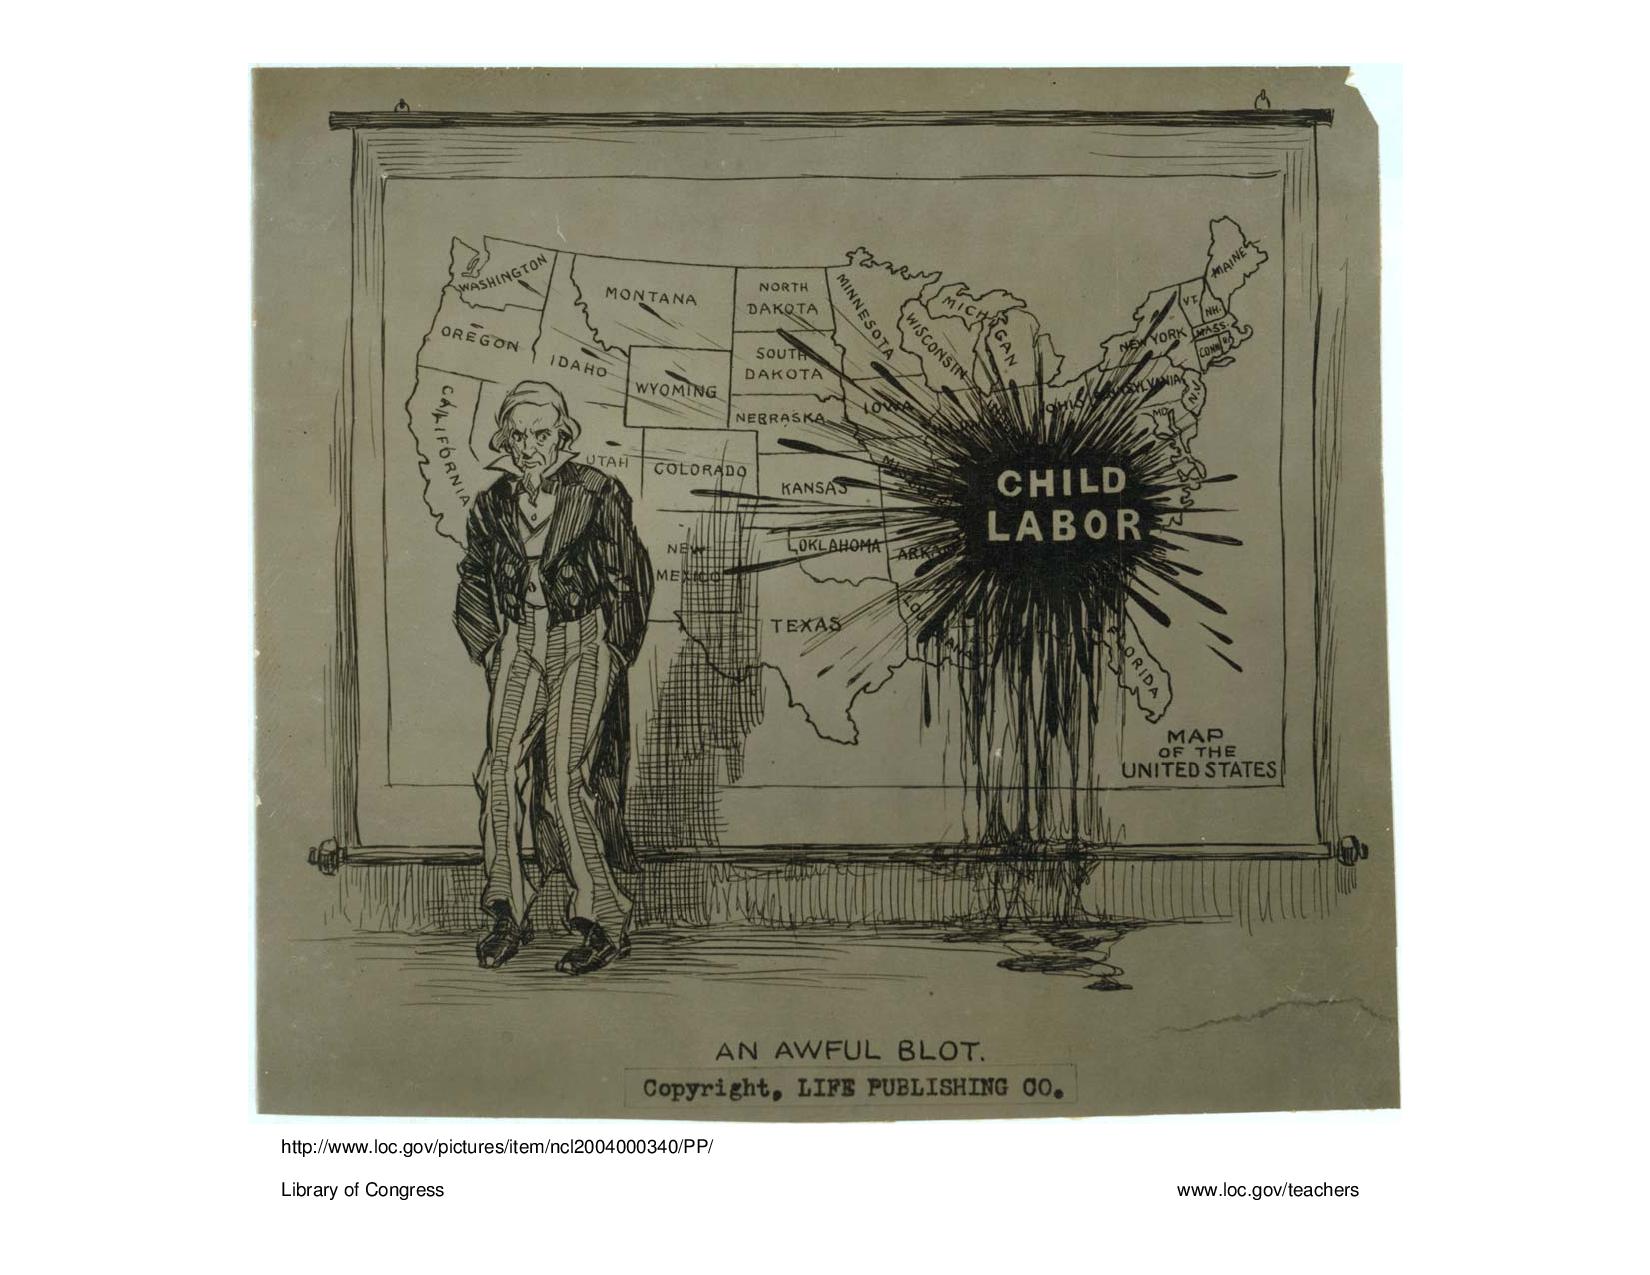
Based on the content of this cartoon it was probably drawn during the __________________.
War of 1812
Progressive Era
Clinton administration
Spanish-American War
Civil Rights Era
Progressive Era
The cartoon is centered around the use of child labor in the United States. Answering this question requires you to know a little bit about this topic, or at least enough about the various eras mentioned to be able to make a logical guess. Of course, in modern times, the use of child labor is banned in the United States; however, during the industrial revolution it was exceedingly common to find children, particularly boys, as young as eight or ten working in factories. This is generally true of all the western nations during the industrial revolution. Towards the end of the nineteenth century, and in the early twentieth century, there was a massive social backlash against the use of child labor. It played an important role in the Progressive movement of the first two decades of the twentieth century.
Example Question #2 : Political Cartoons

The visual personification of the United States (shown in the comic above) is usually called _________________.
Uncle Sam
Captain America
General Washington
John Bull
Manifest Destiny
Uncle Sam
The man shown looking disdainfully towards the map of the United States is Uncle Sam. He appears throughout American history as a personification ("human representation") of the American Republic. He is particularly prominent in political cartoons and government propaganda. His counterpart in England is called John Bull.
All GED Social Studies Resources


