Algebra II : Basic Statistics
Study concepts, example questions & explanations for Algebra II


All Algebra II Resources
Example Questions
Example Question #45 : Mode
The 2014 Sinquefield Cup consisted of nine total rounds. In this chess tournament, a win is worth one point, a draw is worth half a point, and a loss is worth no point. At the end of the tournament, the player with the highest score wins the tournament. Below are the scores of the players.
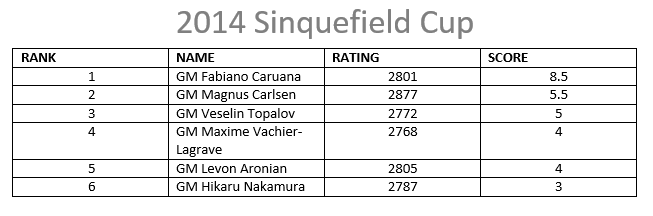
Find the mode of the scores.


There is no mode.
To find the mode of the terms, you must find the term that is repeated the most.
Since 

Solution:

Example Question #361 : Basic Statistics
What is the mode of the following set of numbers:


The mode of a set of numbers is the number that occurs most frequently,

in this case it is 
Example Question #1 : Frequency Distributions
The number of runs scored per game by a little league baseball team is represented by the following frequency distribution:
| Number of Runs Scored | Frequency |
| 0 | 5 |
| 1 | 2 |
| 2 | 7 |
| 3 | 9 |
| 4 | 3 |
| 5 | 0 |
| 6 | 4 |
| 7 | 2 |
| 8 | 2 |
| 9 | 1 |
Using this frequency table, select the correct answer of mean runs scored by the little league team (rounded to the nearest hundredth).


There's not enough information present to determine the mean.


| Number of Runs Scored | Frequency |
| 0 | 5 |
| 1 | 2 |
| 2 | 7 |
| 3 | 9 |
| 4 | 3 |
| 5 | 0 |
| 6 | 4 |
| 7 | 2 |
| 8 | 2 |
| 9 | 1 |
To determine the mean, first the data set should be re-written in sequential order:

The formula to determine mean is:

The mean is approximately 3.37 runs scored per game.
Example Question #2 : Frequency Distributions
Thousands of people in the United States were surveyed about their grandparents. This frequency table shows their answer to the question "how many of your grandparents were born outside of the US?
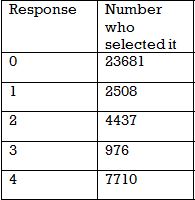
Of the people who had at least one grandparent born outisde of the US, what percent had exactly 3 non-US born grandparents?


Adding up the total number of grandparents that were born outside the U.S. is our first step in solving this problem.
There are

So


Example Question #3 : Frequency Distributions
Thousands of people in the United States were surveyed about their grandparents. This frequency table shows their answer to the question "how many of your grandparents were born outside of the US?"
Is this data normally distributed?
No
Need more information
Partly
Yes
No
No - normally distributed data has a low frequency of responses at the high and low ends. Also, the majority of the data is in the middle.
In this data set, the majority of people said "0," and the fewest people said "3" which is near the middle of the data. If this data was normally distributed we would have a higher frequency between 1 and 3 and much lower values for 0 and 4.
Example Question #4 : Frequency Distributions
What is the correct frequency distribution for this data set?
1 3 5 2 5 2 4 1 5
2 4 1 2 3 5 5 2 3
3 1 4 4 6 2 3 2 4


Count the number of times each number appears in the data set.
The number 1 appears 4 times, so the first line is 
Then number 2 appears 7 times, so the next line is 
Continuing in this fashion we see that the numbers 3, 4, and 5 appears 5 times and 6 appears once.
Therefore combining these together we get the following answer:
Example Question #1 : Frequency Distributions
What is the mean of the data in this frequency table?
# Frequency
1 3
2 4
3 0
4 2


The frequency table represents the data set:
1, 1, 1, 2, 2, 2, 2, 4, 4.
The sum is 19 and there are 9 data points, so the mean is

Example Question #2 : Frequency Distributions
What is the median of the data in this frequency table?
# Frequency
1 3
2 4
3 0
4 2


The frequency table represents the data set:
1, 1, 1, 2, 2, 2, 2, 4, 4.
The median is 2 because 4 data points appear before and after the center 2.
Example Question #3 : Frequency Distributions
Which frequency table has a median of 5? (The first column represents the data points, the second column the frequency)


The correct frequency table represents the data set 3, 4, 5, 5, 6, 6, 8.
Since there are 7 data points our median will be the 4th spot which makes the value 5. It occures at the 4th spot because at that spot half the data points are below it while the other half are above it.
The center number of that data set is 5 as required.
Example Question #361 : Basic Statistics
Determine the first quartile and third quartile from the following list:


To find the first and third quartile of the data set we first need to find the median of the data set. The median is the middle entry of the data set when entries are in ascending order therefore, the median is 10.
To find the first quartile, we need to break our data set into a subset that is between the first entry and the median. This set is:

Because the first quartile is the median of this subset we get the first quartile to equal 3.
The third quartile is found by taking the subset that is the median to the last entry of the data set. This subset is:

Because the third quartile is the median of the new subset we get the third quartile to equal 25.


Certified Tutor

All Algebra II Resources

