Algebra II : Representing Data
Study concepts, example questions & explanations for Algebra II


All Algebra II Resources
Example Questions
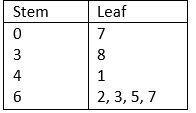
Example Question #1 : Stem And Leaf Plots

Above is a stem-and-leaf representation of the scores on a test administered to a group of students. What was the mode of the scores?

The set of scores has more than one mode.


The mode of the data set is the score that occurs the most frequently.
Each "stem" in the left column represents the tens digits of the scores; each of the numbers in its row, or "leaf" represents the units digits. The entry that occurs the most frequently is represented by the "6" in the "7" row, so 76 is the one and only mode.
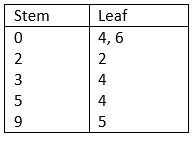
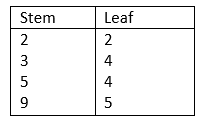
Example Question #1 : Basic Statistics
Above is a stem-and-leaf plot for the test scores administered to a group of students.
What was the median score?


Each of the numbers in the leftmost column, or "stems" represents the tens digits of one or more scores; each digit in one of the rows, or "leaf", represents the units digit of a score.
The median score is the score that occurs in the middle when the scores are arranged from least to greatest, which there are, so we count up until we get to the middle score. There are 53, so we look for the

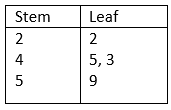
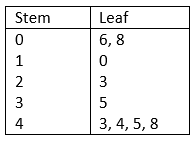
Example Question #1 : Stem And Leaf Plots
List the data values for the given Stem and Leaf plot.
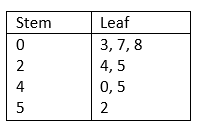
2, 5, 25, 30, 42, 52, 70, 80
3, 7, 8, 24, 25, 45, 52
24, 25, 40, 45, 52
3, 7, 8, 24, 25, 40, 45, 52
3, 7, 8, 24, 25, 40, 45, 52
The tens-digits are in the Stem column (left-side) while the ones-digits are in the Leaf column (right-side). Therefore, the data in the Stem and Leaf plot can be written as:

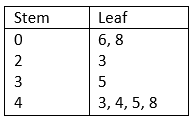
Example Question #1 : Basic Statistics
List the data values for the given Stem and Leaf plot.
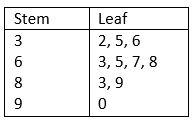
23, 53, 63, 36, 56, 76, 86, 38, 98, 9
32, 35, 36, 63, 65, 67, 68, 83, 89, 90
32, 35, 36, 63, 67, 68, 83, 89, 90
32, 35, 36, 63, 65, 667, 68, 83, 89
32, 35, 36, 63, 65, 67, 68, 83, 89, 90
The tens-digits are placed in the Stem column (left-side) and the ones-digits are placed in the Leaf column. Therefore, the data in the Stem and Leaf plot can be written as:

Example Question #2 : Basic Statistics
List the data values for the given Stem and Leaf plot.
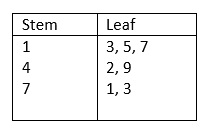
31, 51, 71, 24, 94, 17, 37
13, 15, 17, 42, 49, 71, 73
13, 15, 42, 49, 71, 73
13, 15, 17, 42, 71, 73
13, 15, 17, 42, 49, 71, 73
The tens-digits are placed in the Stem column (left-side) and the ones-digits are placed in the Leaf column. Therefore, the data in the Stem and Leaf plot can be written as:

Example Question #1 : Stem And Leaf Plots
List the data values for the given Stem and Leaf plot.
07, 38, 62, 63, 65, 67
70, 83, 14, 26, 23, 25, 27
38, 41, 62, 63, 65, 67
7, 38, 41, 62, 63, 65, 67
7, 38, 41, 62, 63, 65, 67
The tens-digits are placed in the Stem column (left-side) and the ones-digits are placed in the Leaf column. Therefore, the data in the Stem and Leaf plot can be written as:

Example Question #1 : Basic Statistics
Create the Stem and Leaf plot for the given data values.

The tens-digits are placed in the Stem column (left-side) and the ones-digits are placed in the Leaf column.
The list of values is:
34, 54, 6, 95, 22, 4
This data can also be written as 04, 06, 22, 34, 54, 95
Example Question #3 : Basic Statistics
Create the Stem and Leaf plot for the given data values:
6, 8, 10, 23, 35, 43, 44, 45, 48
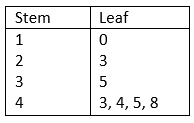
The tens-digits are placed in the Stem column (left-side) and the ones-digits are placed in the Leaf column.
The data values are:
6, 8, 10, 23, 35, 43, 44, 45, 48
We can rewrite it as follow
06, 08, 10, 23, 35, 43, 44, 45, 48
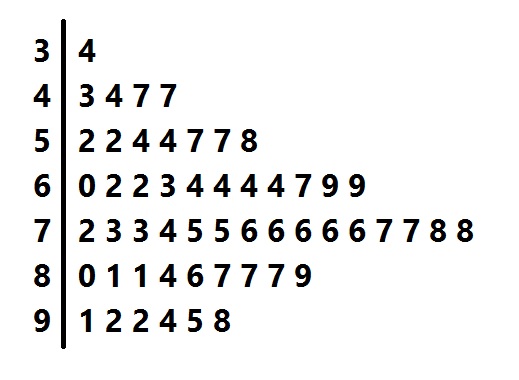
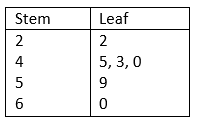
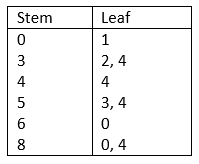
Example Question #9 : Representing Data

Which of the following represents the correct median value of the above Stem and Leaf Plot?


Impossible to determine based on the data provided.
There are 18 data points in this set, so the median lies halfway between the 9th and 10th sequential data point:
9th Point:

10th Point:

And:

The correct median value of the data set is 74
Example Question #1 : Box And Whisker Plots
Draw a Box and Whisker plot for the following data set.

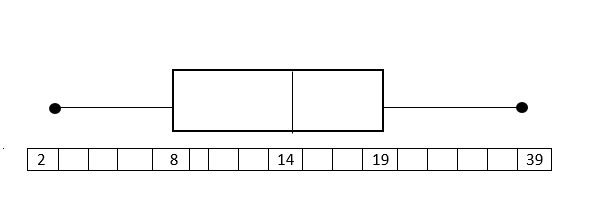
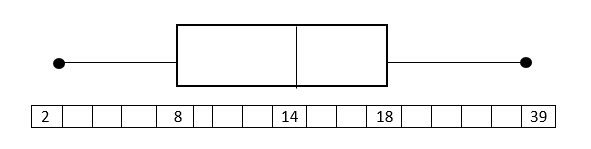
Put the data in numerical order (from smallest to largest) if it isn't already. In order to find the median, divide the data into two halves. In order to divide the values into quartiles, find the median of the two halves.

1st quartile: 


Median of 1st quartile:

2nd quartile = Median of total set:

3rd quartile: 


Median of 3rd quartile:

To construct the Box and Whisker Plot we use the minimum and the maximum value in the data set as the ends of the whiskers. To construct the box, we plot a line at the median of the 1st quartile, the median of our total data set, and at the median of the 3rd quartile. Then we connect the tops and bottom of the lines. The result is as follows:
The endpoints (black dots) represent the smallest and largest values, in this case, 2 and 39.


All Algebra II Resources

