Trigonometry : Graphing Sine and Cosine
Study concepts, example questions & explanations for Trigonometry


All Trigonometry Resources
Example Questions
Example Question #1 : Graphing Sine And Cosine
The function shown below has an amplitude of ___________ and a period of _________.
 = -4cos(3\pi x) +3")


The amplitude is always a positive number and is given by the number in front of the trigonometric function. In this case, the amplitude is 4. The period is given by 

Example Question #1 : Graphing Sine And Cosine
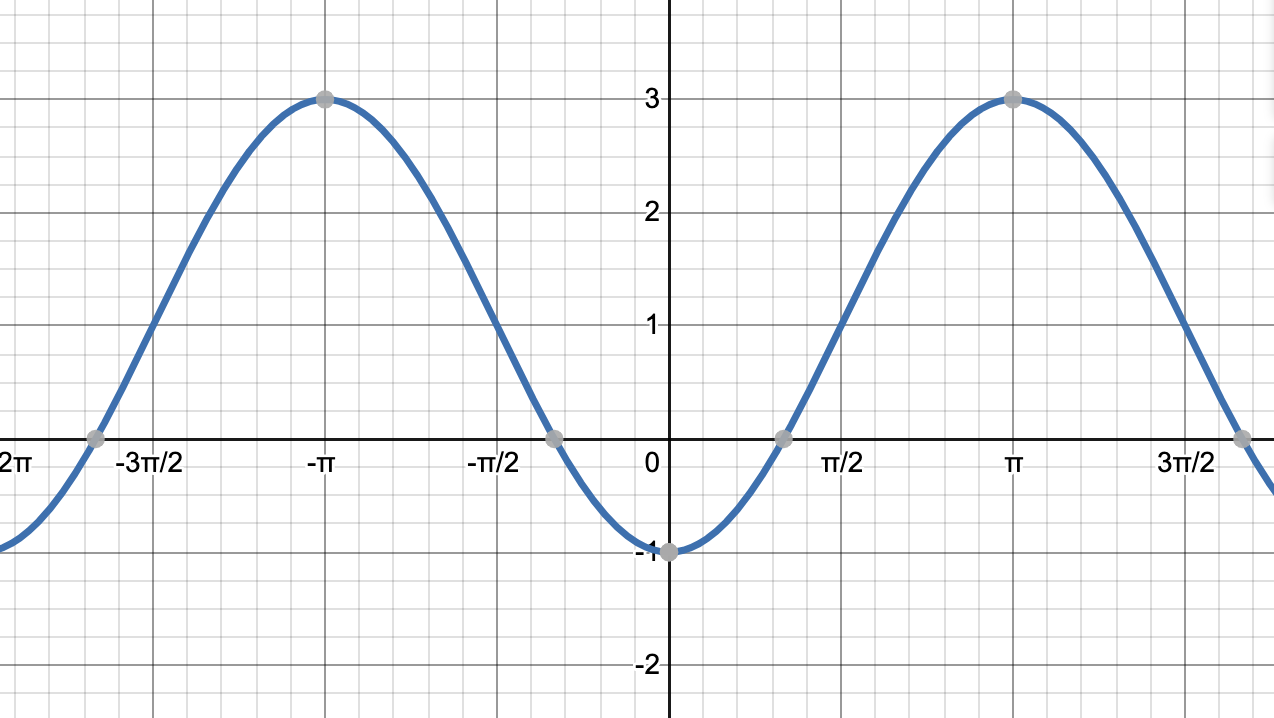
This is the graph of what function?
=\frac{3}{2}\sin x")
=2\sin x+3")
=3\sin x+2")
=\frac{2}{3}\sin x")
=2\sin x-3")
The amplitude of the sine function is increased by 3, so this is the coefficient for ")


Example Question #3 : Graphing Sine And Cosine
Which of the following graphs does not have a 


")
")
The y-intercept is the value of y when 
Recall that cosine is the 
 = 1")
Secant is the reciprocal of cosine, so it also works.
Also recall that  = sin(90 - x)")
")
Example Question #2 : Graphing Sine And Cosine
Which graph correctly illustrates the given equation?
-2")
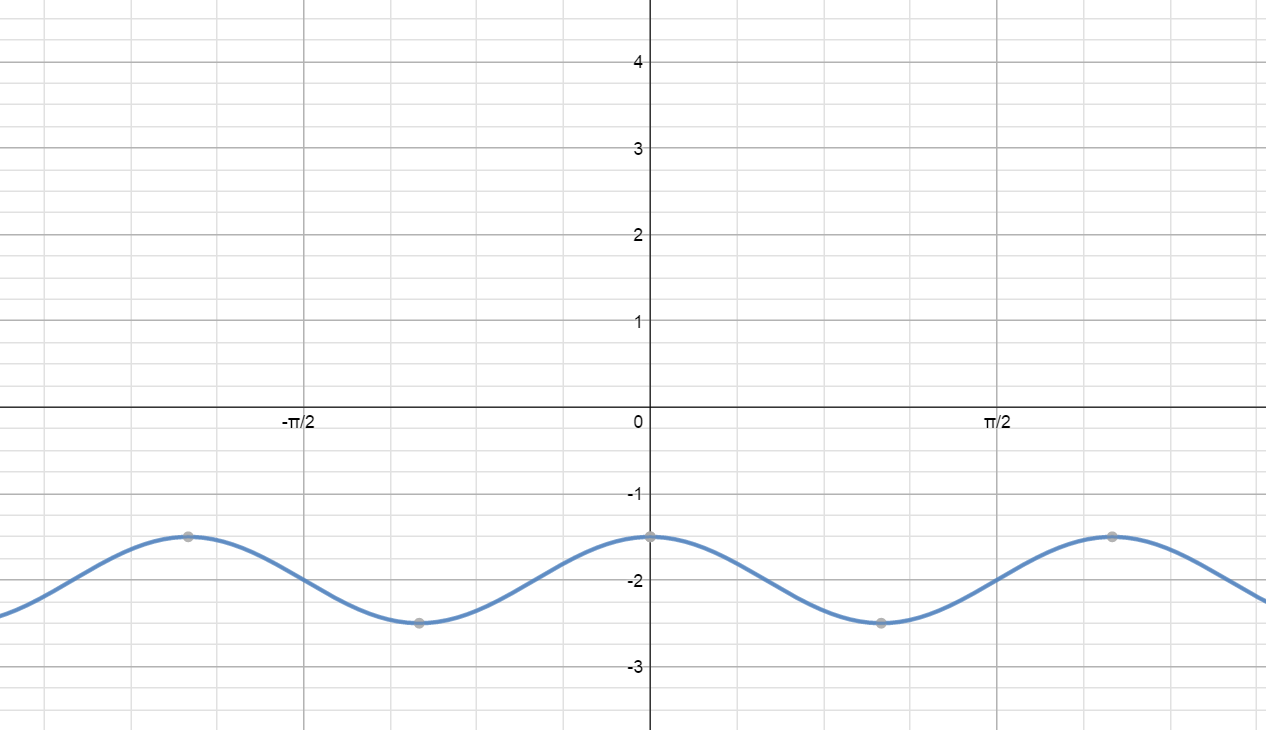

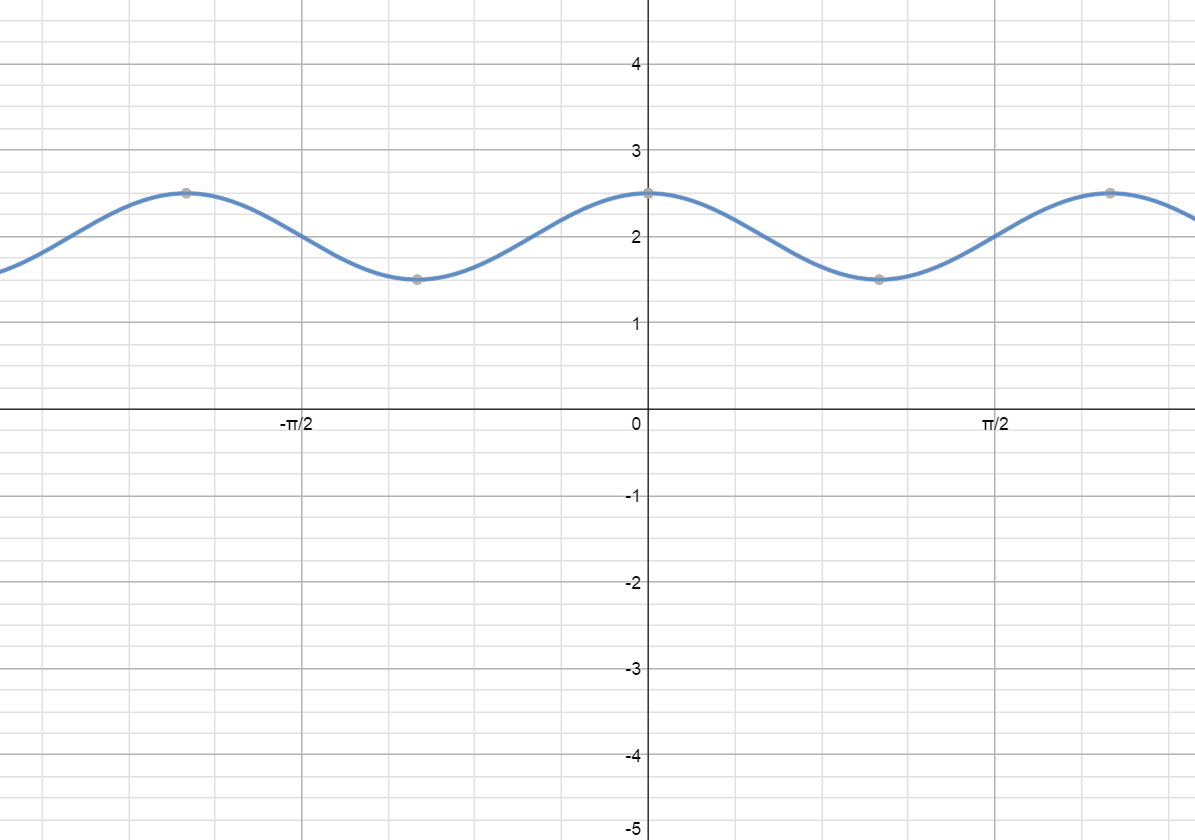
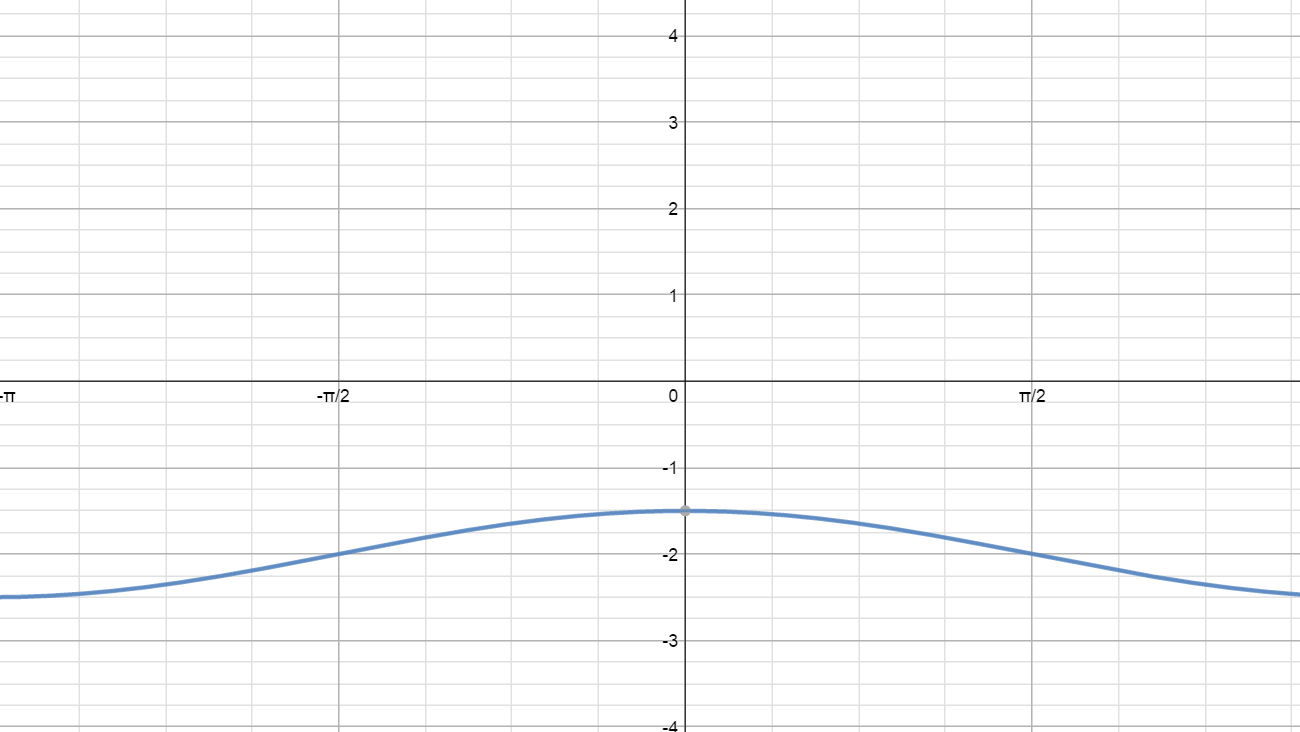
The simplest way to solve a problem like this is to determine where a particular point on the graph would lie and then compare that to our answer choices. We should first find the y-value when the x-value is equal to zero. We will start by substituting zero in for the x-variable in our equation.
)-2=\frac{1}{2}cos(0)-2")
-2=\frac{1}{2}(1)-2")
-2=\frac{1}{2}-2")

Now that we have calculated the y-value we know that the correct graph must have the following point:
")
Unfortunately, two of our graph choices include this point; thus, we need to pick a second point.
Let's find the y-value when the x-variable equals the following:

We will begin by substituting this into our original equation.
\right)-2=\frac{1}{2}cos \left( \frac{3\pi}{2} \right)-2")
-2=\frac{1}{2}(0)-2")
-2=0-2=-2")
Now we need to investigate the two remaining choices for the following point:
")
Unfortunately, both of our remaining graphs have this point as well; therefore, we need to pick another x-value. Suppose the x-variable equals the following:

Now, we must substitute this value into our given equation.
\right)-2=\frac{1}{2}cos\left(\frac{3\pi}{4}\right)-2")
-2=\frac{1}{2}\left(-\frac{\sqrt{2}}{2}\right)-2")
-2=-\frac{\sqrt{2}}{4}-2")

Now, we can look for the graph with the following point:
")
We have narrowed in on our final answer; thus, the following graph is correct:
Example Question #5 : Graphing Sine And Cosine
Let ")
=2\sin(x-\pi)+3")
The 3 in the function above affects what attribute of the graph of ")
Period
Phase shift
Vertical shift
Amplitude
Vertical shift
The period of the function is indicated by the coefficient in front of 
The amplitude of the function is given by the coefficient in front of the 
The phase shift is given by the value being added or subtracted inside the 

The only unexamined attribute of the graph is the vertical shift, so 3 is the vertical shift of the graph.
Example Question #2 : Graphing Sine And Cosine
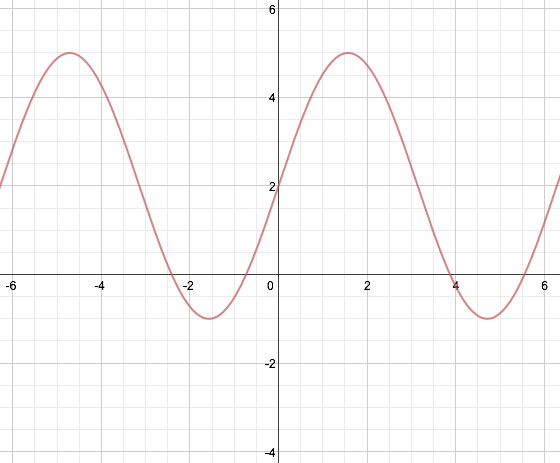
What is an equation for the above function, enlarged below?
")
")
")
")
")
The amplitude of a sinusoidal function is 


The graph moves through the origin, so it is either a sine or a shifted cosine graph.
It repeats once in every 


The only answer in which both the correct amplitude and period is found is:
")
Example Question #1 : Graphing Sine And Cosine
What is the domain of the sine function? What is the domain of the cosine function?
Domain of sine:

Domain of cosine:

Domain of sine:

Domain of cosine: all real numbers
Domain of sine: all real numbers
Domain of cosine: all real numbers
Domain of sine: all real numbers
Domain of cosine:

Domain of sine: all real numbers
Domain of cosine: all real numbers
Both sine and cosine functions go on infinitely to the left and right when viewed on a graph. For this reason, each of these functions has domains of "all real numbers."
Alternatively, each of these functions ranges between -1 and 1 in the y direction. The incorrect answers all include 
Example Question #2 : Graphing Sine And Cosine
Which of the following would correctly translate the function 

Shift 
Shift 
Shift 

Shift 

Shift 

Shift
The graph of 


Example Question #9 : Graphing Sine And Cosine
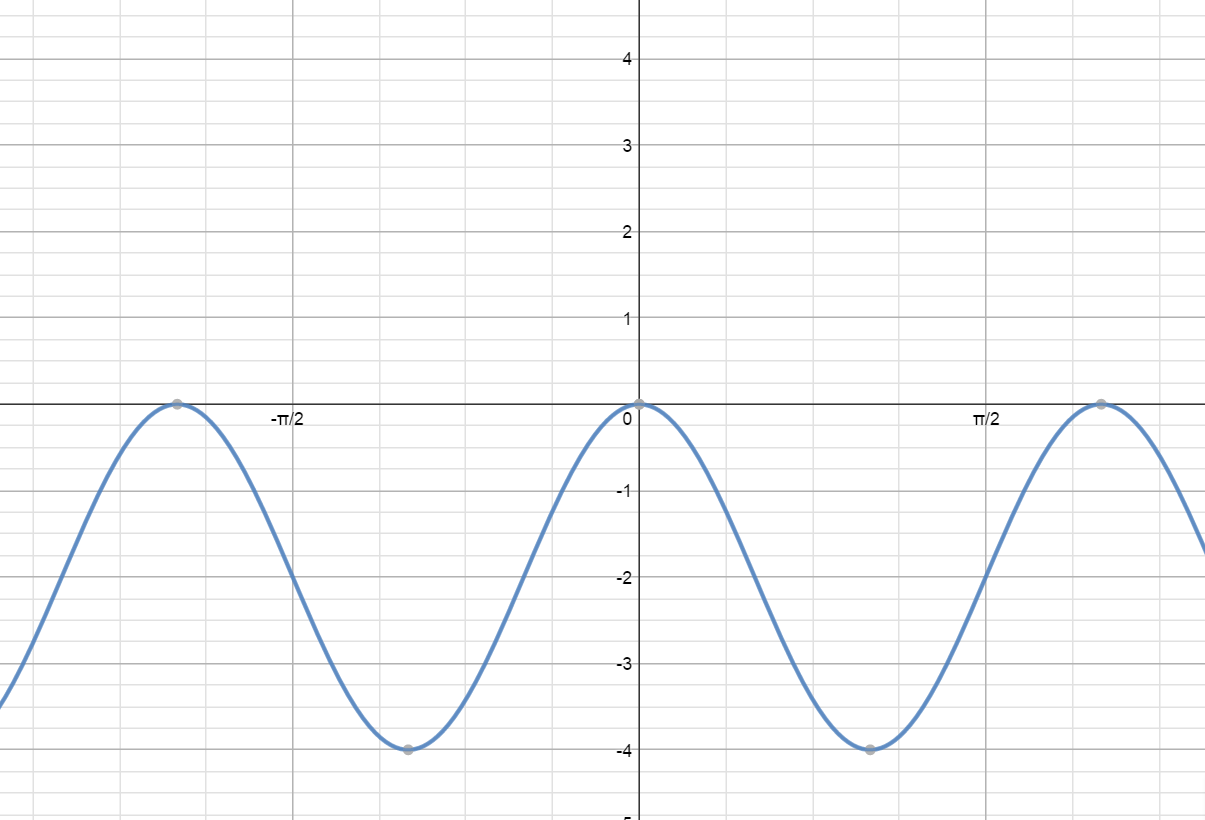
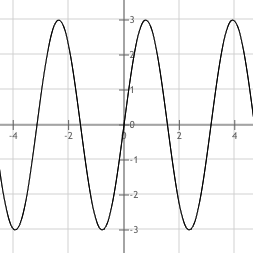
Which of the following graphs represents the function =-2\cos x+1")


The graph of =-2\cos x+1")
This graph goes through three transformations. First, take the graph of 

Finally, we need to shift the graph up 1 unit. This is represented by the black graph, below.

The incorrect answers display the graphs of the functions =2\cos x +1")
=-2\cos x +4")
=-\cos x +3")


Certified Tutor

All Trigonometry Resources

