Create an account to track your scores
and create your own practice tests:
All Statistics Resources
Want to review Statistics but don’t feel like sitting for a whole test at the moment? Varsity Tutors has you covered with thousands of different Statistics flashcards! Our Statistics flashcards allow you to practice with as few or as many questions as you like. Get some studying in now with our numerous Statistics flashcards.
 on the Scholastic Assessment Test (SAT). A college admissions committee does not know how the exam is scored; however, they do know the scores of the exam form a normal distribution pattern. They also know the mean score and standard deviation of the population of students that took the test.


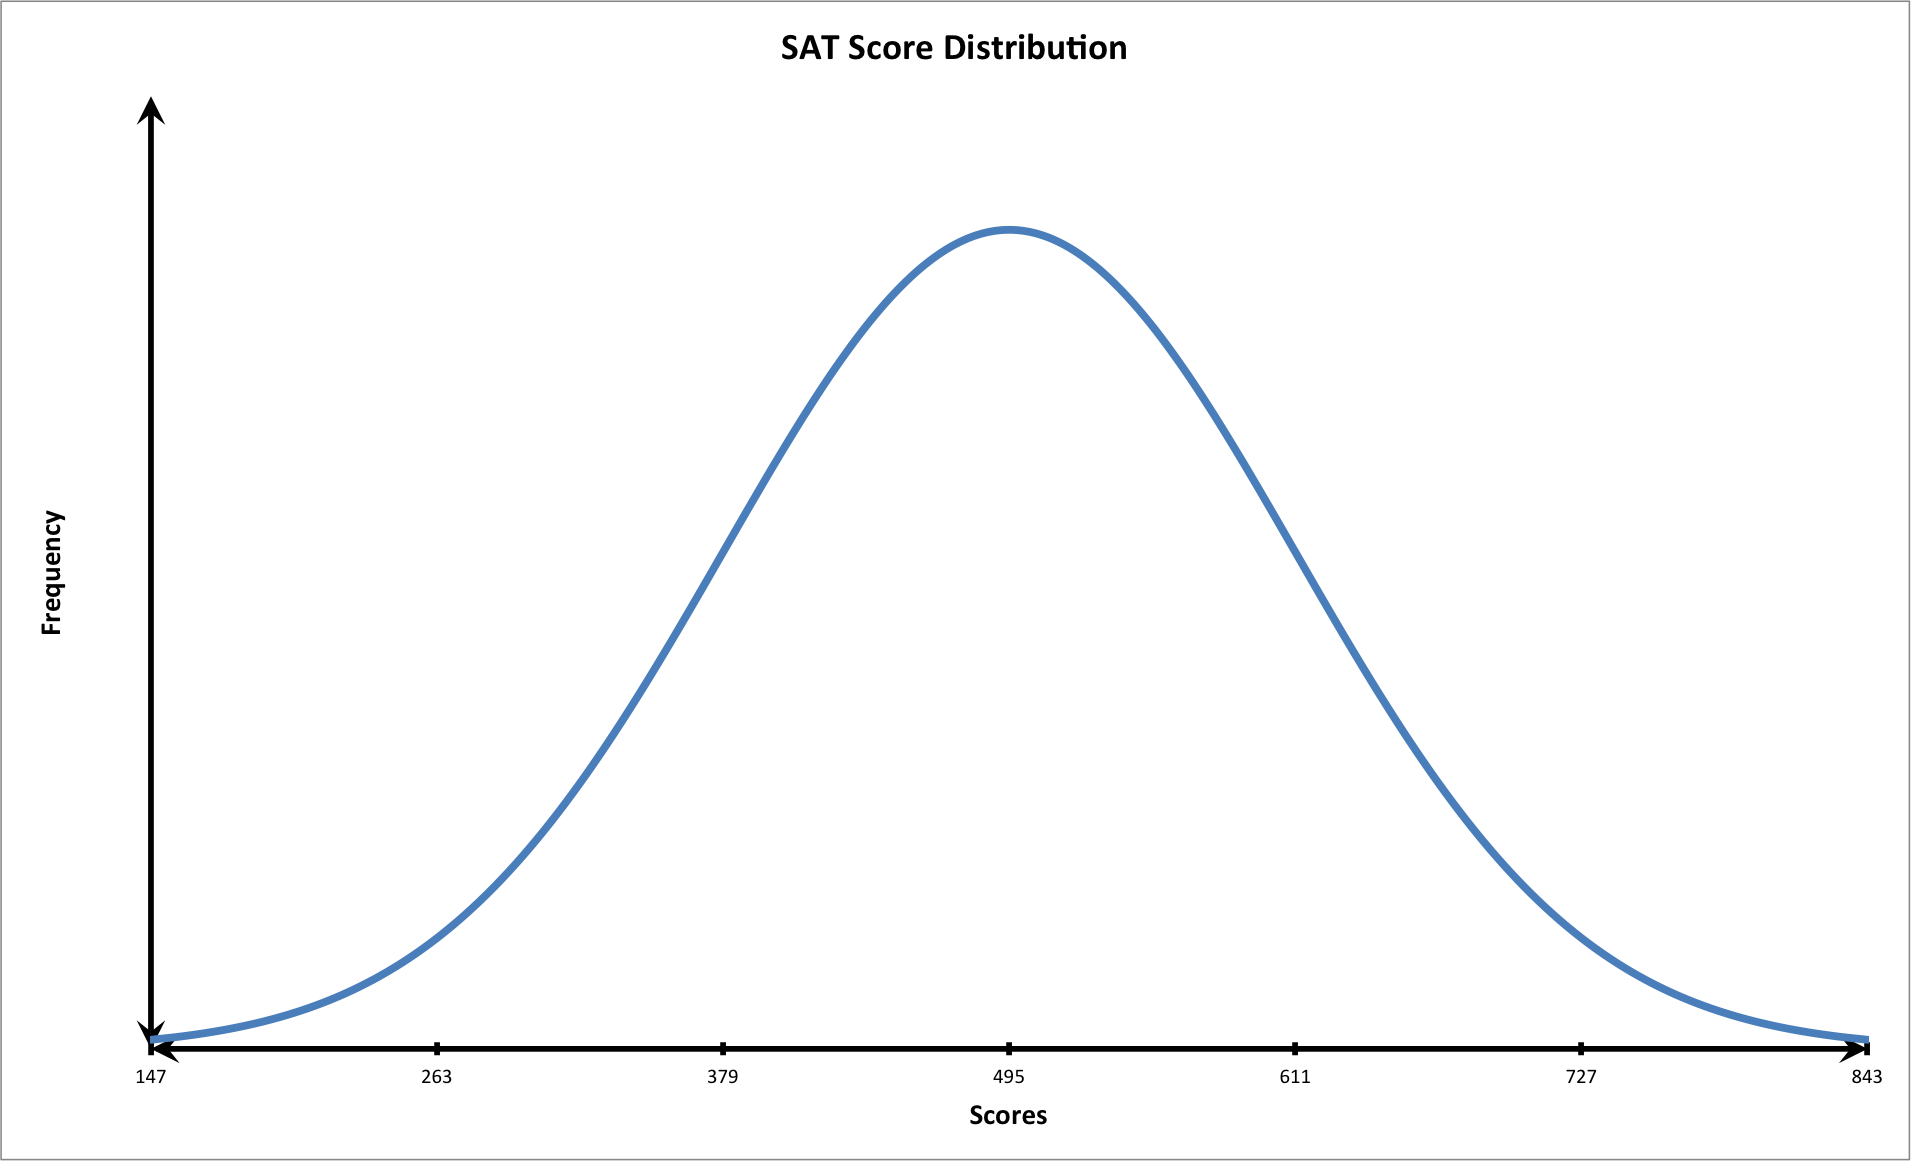

+\bar{x}=(2\times116)+495=727")


Donna
Certified Tutor
Certified Tutor
Indiana University of Pennsylvania-Main Campus, Bachelor of Science, Education of Developmentally Delayed Individuals. Grand ...

Popular Subjects
Reading Tutors in San Francisco-Bay Area, French Tutors in Seattle, GRE Tutors in Phoenix, LSAT Tutors in Chicago, French Tutors in Dallas Fort Worth, Reading Tutors in Denver, SSAT Tutors in Miami, ISEE Tutors in Seattle, SAT Tutors in Atlanta, Computer Science Tutors in Atlanta
Popular Courses & Classes
Spanish Courses & Classes in Chicago, SAT Courses & Classes in Boston, LSAT Courses & Classes in San Francisco-Bay Area, GRE Courses & Classes in Denver, LSAT Courses & Classes in Seattle, GRE Courses & Classes in Los Angeles, SSAT Courses & Classes in Denver, SAT Courses & Classes in Seattle, ACT Courses & Classes in Boston, SAT Courses & Classes in Philadelphia
Popular Test Prep
SAT Test Prep in Dallas Fort Worth, GMAT Test Prep in Philadelphia, ACT Test Prep in Boston, SAT Test Prep in Boston, ACT Test Prep in Denver, SSAT Test Prep in Denver, GRE Test Prep in Philadelphia, LSAT Test Prep in San Francisco-Bay Area, ACT Test Prep in Phoenix, ACT Test Prep in Seattle

