SAT Mathematics : Working with Statistics
Study concepts, example questions & explanations for SAT Mathematics


All SAT Mathematics Resources
Example Questions
Example Question #11 : Probability & Statistics
If the set {10, 5, 9, x} has a median of 7, which of the following could not be a possible value of x?
5
3
7
1
7
When you are asked to find the median, your first step should always to be to check to see if the numbers are in ascending order. If they aren’t, your next step should be to put them in order. If you have variables, remember that without any additional information about the set, you don’t know where in the set the variable should be placed, so just put it to one side or the other until you integrate additional information. For this set, you should rearrange them to get:
{5, 9, 10, x}
You are also told that the median to this set is 7. Since the set has an even number of terms, that means that 7 must be the average of the two middle numbers. And since 7 is halfway between 5 and 9, those two numbers must be the two middle numbers. You can therefore rewrite the set in ascending order as
{x, 5, 9, 10}
It should be obvious that x could be 1, 3, or 4. It could also be 5, since that would not change the median at all since the two middle numbers would still be 5 and 9. However, it could not be 7, since the average of 7 and 9 is 8, not 7.
Example Question #2 : Working With Statistics
Over five different years, the total rainfall in Brooks County was, in ascending order, 15 inches, 24 inches, 
35
32
36
30
36
Since the five values are given in ascending order, you know that the median - which is defined as the middle value for an odd-numbered set - is the third value, xx. For the median to then equal the mean, you'll calculate the mean. The mean is the sum of the values divided by the number of values, or here: 
Median = Mean

Now you can solve for xx. To eliminate the denominator, multiply both sides by 5 to get:

Then combine like terms:

Then subtract 

Then you can solve for 
Example Question #3 : Working With Statistics
Over the first 

11
8
9
10
9
Remember that Average = Sum of Terms divided by Number of Terms. Using that equation, you can determine:
How many points Martin scored total in the first 


How many points Martin scored total in the whole season: That 


Now using that, and knowing that there were 
")
")
So your calculation is:

Multiply both sides by the denominator of 
=32x+14")
Distribute the multiplication to get:

And then subtract 30x30x and 1414 from each side to combine like terms and you'll have:

So

But remember that the total number of games is 

Conceptually, you could also realize that the difference between his average before the last game (32) and his points in the last game (14) is 18 points. For that 18 points to result in a decrease of 2 in the average (from 32 to 30), it must have been distributed over 9 games (18 divided by 9 = 2).
Example Question #4 : Working With Statistics
If the median of the numbers in list A below is equal to the median of the numbers in list B below, what is the value of y?
List A: 5, 20, 32, 37
List B: y, 5, 20, 32, 37
15
5
26
32
26
This problem tests the definition of “median.” Remember: the median is the middle value in a set with an odd number of elements (like List B). However, with sets containing an even number of elements (like List A), there can be no single “middle” element. Therefore, the median for sets containing an even number of elements is the average between the two numbers equally “in the middle.”
One of the first things we should notice with this problem is that the only difference between List A and List B is the addition of element y. The sets are otherwise identical. The problem tells us that the medians of the two sets are the same. Since List B contains an unknown element, we cannot initially calculate its median. However, the median of List A is fairly easy to calculate: it is the average between the two middle values (in this case, the average of 20 and 32 = 26. Since the medians of the two sets are the same, y must be equal to this new median.
This problem can also be solved by avoiding any math. Conceptually speaking, we know that the median for List A is going to be somewhere between 20 and 32. Since all of the elements of List A are contained in List B and because the problem states that the two lists have the same median, the extra element in List B, y, must represent the median of both sets. Looking down at the answer choices, there is only one answer between 20 and 32.
Example Question #5 : Working With Statistics
Over a six-game stretch of her basketball season, Sonya scored 50, 47, 40, 43, 55, and 


45
46
48
47
47
Since the average equals the sum of the terms divided by the number of terms, you can set this calculation up as:

Where you have 6 terms (the five knowns, plus xx) and you can quickly sum the given terms by pairing them off to find zeros. 50 + 40 = 90. 47 + 43 = 90. And then there's 55. So 90 + 90 + 55 = 180 + 55 = 235.
Now that you have your equation, multiply both sides by 6:

Then subtract 

And you can solve for 
Example Question #551 : Sat Math
The average (arithmetic mean) of 16 students’ first quiz scores in a difficult English class is 62.5. When one student dropped the class, the average of the remaining scores increased to 64.0. What is the quiz score of the student who dropped the class?
55
25
40
70
40
Solving this problem requires finding the sum of the grades before the dropout and then after the dropout. The difference between those two sums is the answer. To do that, first consider the sum before the dropout: the average of 62.5 times the number of students, which is 16. Use some clever mental math to do this quickly: 16 x 62 = 16 x 60 + 16 x 2 = 960 + 32 or 992. Then add the .5 x 16 or 8 to get an even 1000. Even better, recognize that 62.5 is 

(16)=1000")
Lastly, calculate the sum after the drop: the average of 64 times the number of students, which is 15. Again, use some mental math to do this efficiently: 15 x 64 = 10 x 64 + 1/2 of that value or 640 + 320 = 960. The difference between 1000 and 960 is 40.
Example Question #552 : Sat Math
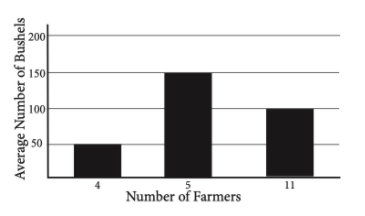
Each of 20 farmers reported the average output of their apple orchards, in bushels per acre. The results of this report were graphed on the histogram above. What is the average number of bushels per acre harvested by the farmers?
110
96.2
102.5
100
102.5
When you are asked to find an average from a histogram, remember that there are two dimensions of information you need to deal with – the number of individuals with each response, and the response given. It is not enough to find the average of 50, 150, and 100 – there are multiple people with each response. You must find the total number of bushels reported by the farmers and then average those.
Remember that the average of a set of numbers can be computed as:

To find the sum, simply multiply the number of farmers with each response by the value of that response. With 4 farmers who responded 50, 5 farmers who responded 150, and 11 farmers who responded 100, that means your sum is 4(50) + 5(150) + 11(100) = 2050.
When you divide the sum, 2050, by the number of terms, 20, you get the answer 102.5.
Example Question #1 : Working With Statistics
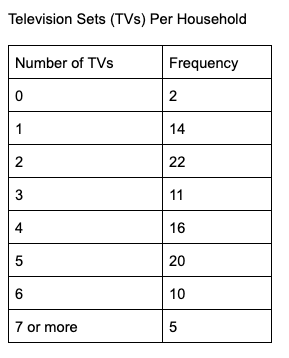
The table above shows the number of television sets that each household, out of 101 total households, in a neighborhood possesses. Based on the table, what is the median number of television sets per household?
3
3.5
2
4
4
The median value is the middle number in a data set, and here you’re told that there are 101 total values, meaning that the 51st value will be the middle number. You can find the median, then, by looking for which number would be the 51st. Reading down the column with the number of households, you can see that 2 (the number of zero-TV households) + 14 (one TV) + 22 (two TVs) + 11 (three TVs) gives you 49 households with 0, 1, 2, or 3 TVs. That means that the 51st value has to be one of the 4-TV households, making the correct answer 4.
Note that frequency tables such as this are a great way to display large data sets, but it takes some familiarity to interpret them properly. Look at the first two rows: 2 households had 0 TVs and 14 households had 1. If we were to list the numbers of TVs for each household, our list would look like:
0, 0, 1, 1, 1, 1, 1, 1, 1, 1, 1, 1, 1, 1, 1, 1…
Visually to show all the data we’d need an even-longer list, so the frequency table is a nice summary, but if you don’t quite see how the answer is 4, you could continue this list with twenty-two 2s, eleven 3s, etc. and then count to find the 51st value. But be warned that 1) that’s time consuming and 2) the SAT does test frequency tables, so it’s a good idea to get used to them.
Example Question #2 : Working With Statistics
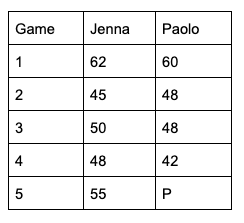
The table above displays the scores for Jenna and Paolo as they played against each other five times in a certain game. If Jenna’s mean score for the set of five games was 2 points higher than Paolo’s mean score, what is the value of P, Paolo’s score for the fifth game?
52
53
51
50
52
There are a few ways that you can solve this problem. One is to simply calculate each player’s mean score. That means taking the sum of each of their scores and dividing by 5. For Jenna, that’s 62 + 45 + 50 + 48 + 55 = 260, which when divided by 5 gives you 52.
Since her mean score is 52, that means that Paolo’s mean score must be 50, so his equation is then:

Then you can solve algebraically by multiplying both sides by 5:
250 = 60 + 48 + 48 + 42 + P
250 = 198 + P
52 = P
Or you can take a shortcut: if you realize that for Jenna’s mean score to be 2 points higher, and that over 5 games that means she needs to have scored 10 total points more, you can scan the table and just pay attention to how far Jenna is cumulatively ahead of Paolo:
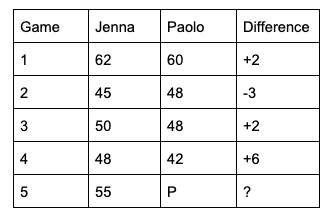
You can see then that before Game 5, Jenna is a total of 7 points ahead, meaning that her Game 5 score of 55 must be 3 higher than Paolo’s so that she’s a total of 10 points ahead. So Paolo’s P must be 52.
Example Question #3 : Working With Statistics
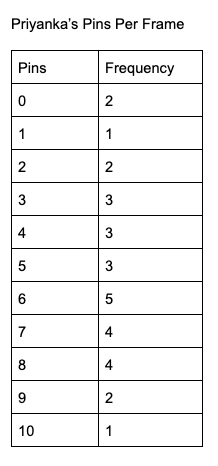
At a bowling party, Priyanka bowled a total of 30 frames. The table above shows how many pins she knocked down per frame. What was the median number of pins she knocked down?
4
6
3
5
6
The median value of a data set is the middle term, provided that there is an odd number of terms, or the average of the two middle terms if there is an even number of terms. Here you’re told that there will be 30 data points, so the median will be the average of the 15th and 16th terms.
The way a frequency table works is to show you how often (frequency) each number appears in the data points. Here that means that you start with two 0s, one 1, two 2s, etc. Since you’re looking for the 15th and 16th terms, you can start adding the frequencies until you get to that term. The first five totals (for pins 0 through 5) sum to 14, meaning that the 15th and 16th values will be 6. This means that the median is 6.
Note that a frequency table is a convenient way to summarize lots of data points; without the table, your data set would look like this:
0, 0, 1, 2, 2, 3, 3, 3, 4, 4, 4, 5, 5, 5, 6, 6, 6, 6, 6, 7, 7, 7, 7, 8, 8, 8, 8, 9, 9, 10
That’s a lot of individual data points, which is why frequency tables are so useful, and why the SAT frequently tests them.

Certified Tutor


All SAT Mathematics Resources

