SAT Mathematics : Functions
Study concepts, example questions & explanations for SAT Mathematics


All SAT Mathematics Resources
Example Questions
Example Question #11 : Working With Function Notation
If =x^{2}+1")
=x^{2}-1")
)")


As with many functions problems, this problem is testing whether you can follow directions. You are given two functions and then asked for the value of a nested function, )")
")
")
Plugging in for ")


)")
")
Your next step will be similar: you just need to take what is in parentheses ")
")

")
^{2}-1")


Notice that you could also plug in a number for 

)")
)")
")

The function )")
")

")
=5^{2}-1=24")
In order to finish this problem, you simply need to plug your original value for 


Example Question #331 : Sat Math
If =\sqrt{x^2-2x+1}")
")
8
9
5
-6
8
Function questions tend to derive most of their difficulty from the abstract function notation itself. So being comfortable with approaching function notation is most of the battle. When you see function notation such as ")


")
")
So when you're given =\sqrt{x^2-2x+1}")
")

=\sqrt{x^2-2x+1}")
=\sqrt{9^2-2(9)+1}")
You can then simplify the math underneath the radical to get:

And since you know that 
Example Question #11 : Functions
The graph of the function ")

7
-4
6
0
0
Some SAT questions ask you to interpret the graph of a function, even if you are not given the algebraic notation for that function. For these, recognize that when a function is graphed, the value of the function is shown on the y-axis (the vertical height) and the input values are displayed on the x-axis (the horizontal). So when this question asks you for the maximum of the function, look for the highest spot on the graph. That takes place at the point (0, 6). Since the question asks for the x-value at which the function is maximized, you'll then use x = 0 as your answer.
Example Question #12 : Functions
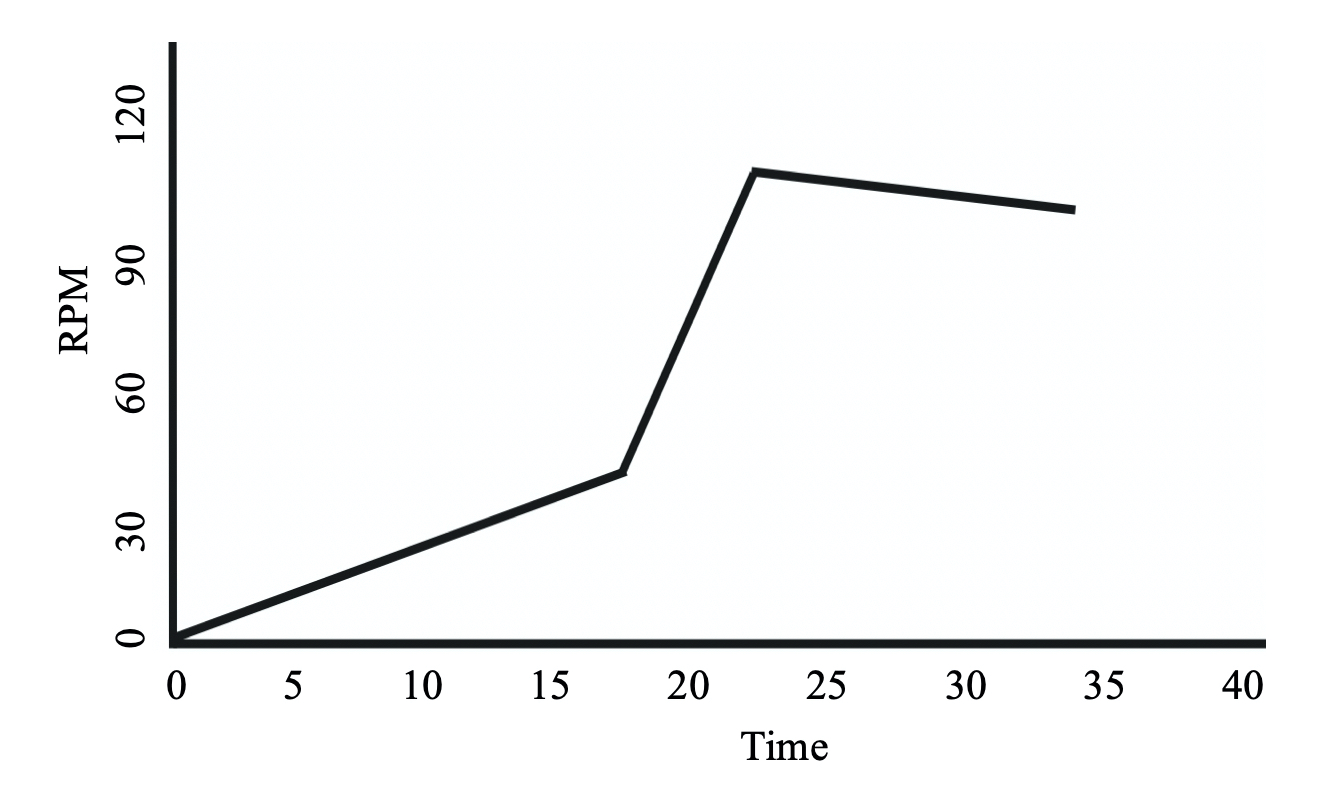
The graph above plots Jessica's workout in a 35-minute spin class, with her number of pedal revolutions per minute (RPM) graphed as a function of elapsed time. Approximately how many minutes into the workout was her revolutions per minute the highest?
18
29
21
35
21
This problem asks you to interpret the graph of a function. As you can see, revolutions per minute are graphed on the y-axis, so to find her highest RPM you're looking for the highest point on the graph. But the question asks for how many minutes she was into the workout at that point, and minutes are on the x-axis. So when you find her highest point, then scan down to the x-axis to see the time, which is at approximately 21 minutes.
Example Question #13 : Functions
The graph of the function ")

20
4
6
9
4
When approaching this problem, it is important to know that in functions, ")


Example Question #14 : Functions
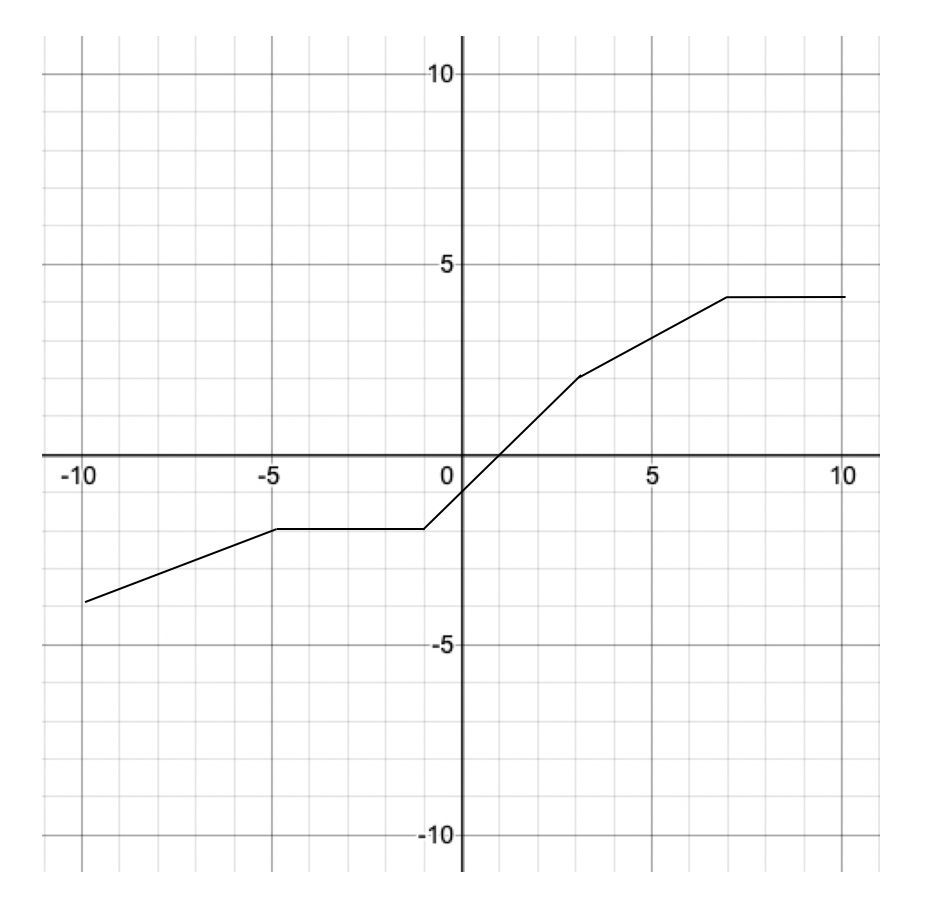
The graph of the function f(x) is given above for all numbers within its domain. At what value of x is the function at its minimum?
10
-4
2
-10
10
An important thing to know about functions is that f(x) is defined as the "function" itself, where x is an input value that goes into the function. So when you're asked for where a function is at its minimum, you're looking on the y-axis for the lowest point. Here that point is at (10, 1). The question asks for x value, so the correct answer is 10.
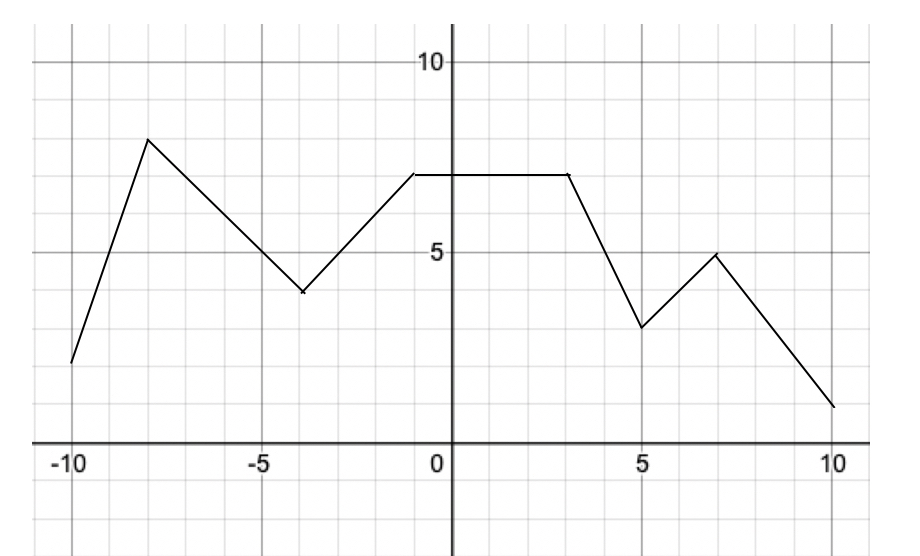
Example Question #13 : Functions
The graph of the function g(x) is given above for all numbers within its domain. At what value of x does the function equal zero?
1
2
-1
0
1
An important consideration when you're interpreting graphs of functions is that the value of the function itself - in this case the function g(x) - is marked on the y-axis (the vertical axis). The x-value is an input value to the function, and the y-value is the value of the function itself. So here you're looking for where the graph crosses the x-axis, at which point y=0. This happens at the point (1, 0). And since the question asks you for the value of x at this point, you'll then provide the correct answer, x = 1.
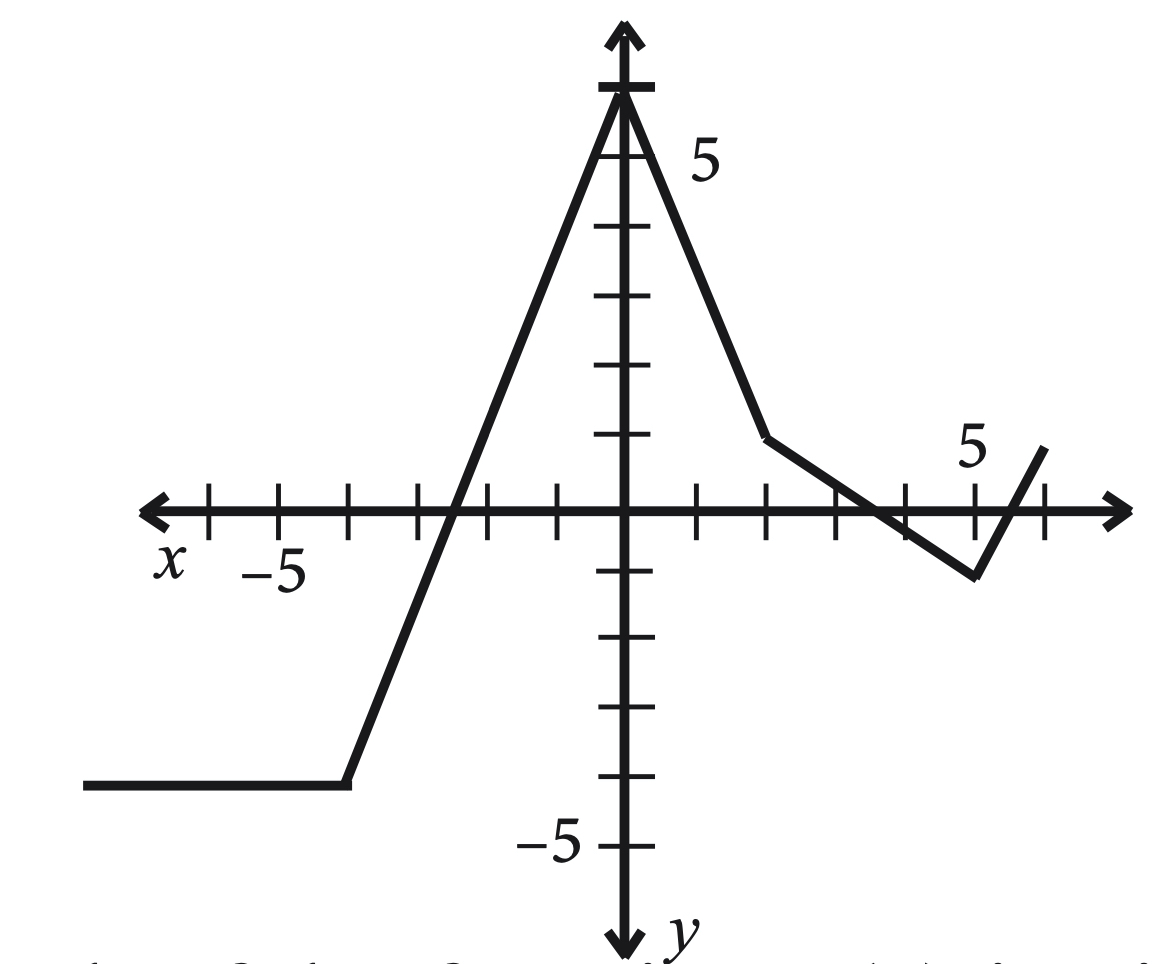
Example Question #14 : Functions
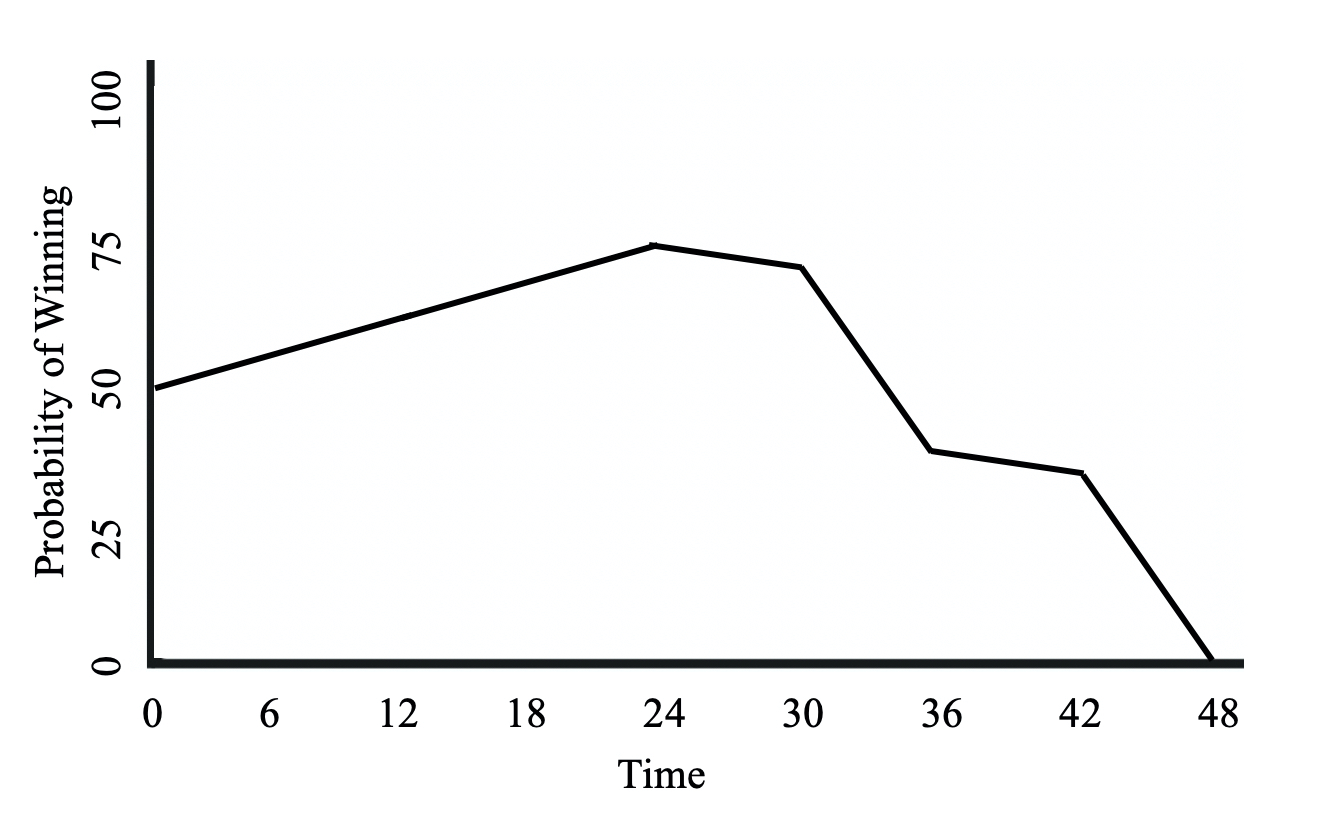
The graph above is a function of a basketball team's probability of winning (shown on the y-axis) as a function of the time elapsed during a 48-minute game (shown on the x-axis). Which of the following best describes the team's performance during the game?
The team lost the game.
The team was significantly better than its opponent during the first half of the game.
The team never had a lead during the second half of the game.
The team played better in the second half of the game than it did during the first.
The team lost the game.
As you can see from the graph, the team gradually increased its probability of winning during the first half of the game, then that probability began to drop gradually in the second half, with two sharp drops until the probability reached 0. This demonstrates that the team lost the game - at the end, its probability of winning was zero. While the team did increase its probability of winning throughout the first half, it did so gradually, so the idea that it was "significantly better than its opponent" is not necessarily true.
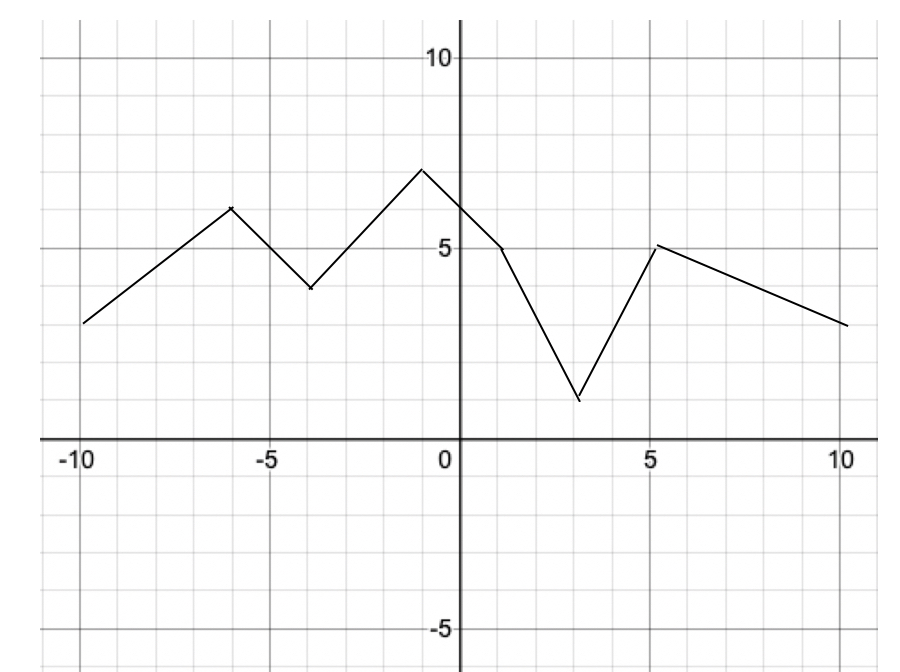
Example Question #2 : Understanding Functions
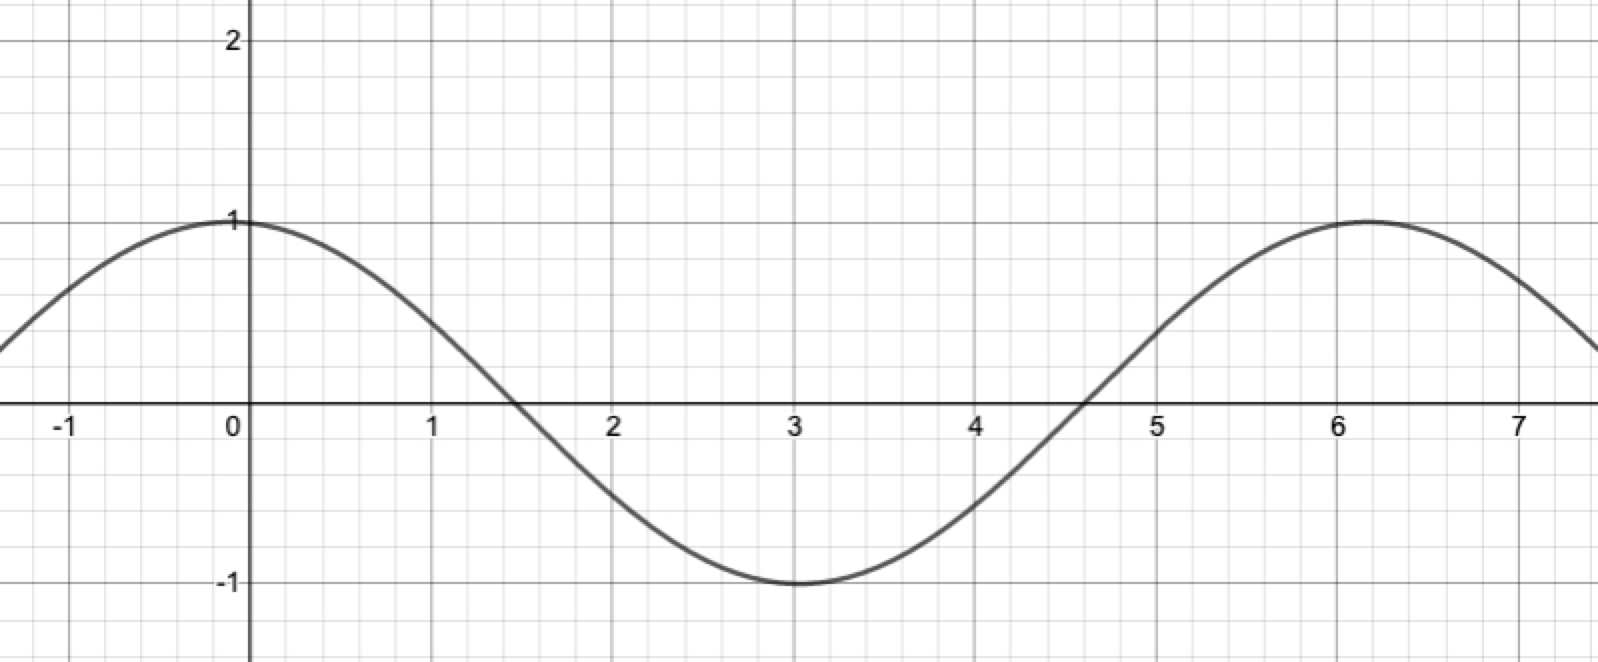
The graph of the function f(x) is given above for all numbers within its domain. At approximately what value of x is the function at its minimum?
-1
6
1
3
3
Importantly when you are dealing with functions, you should know that the value of the function itself is shown on the y-axis (the vertical axis) and the x-axis shows you the input value of x that leads to the value of the function. So here when you're asked for the minimum value of the function, you should look for the lowest point on the graph. That appears at approximately (3, -1). The question asks for the x-value at that point, so the correct answer is 3.
Example Question #15 : Functions
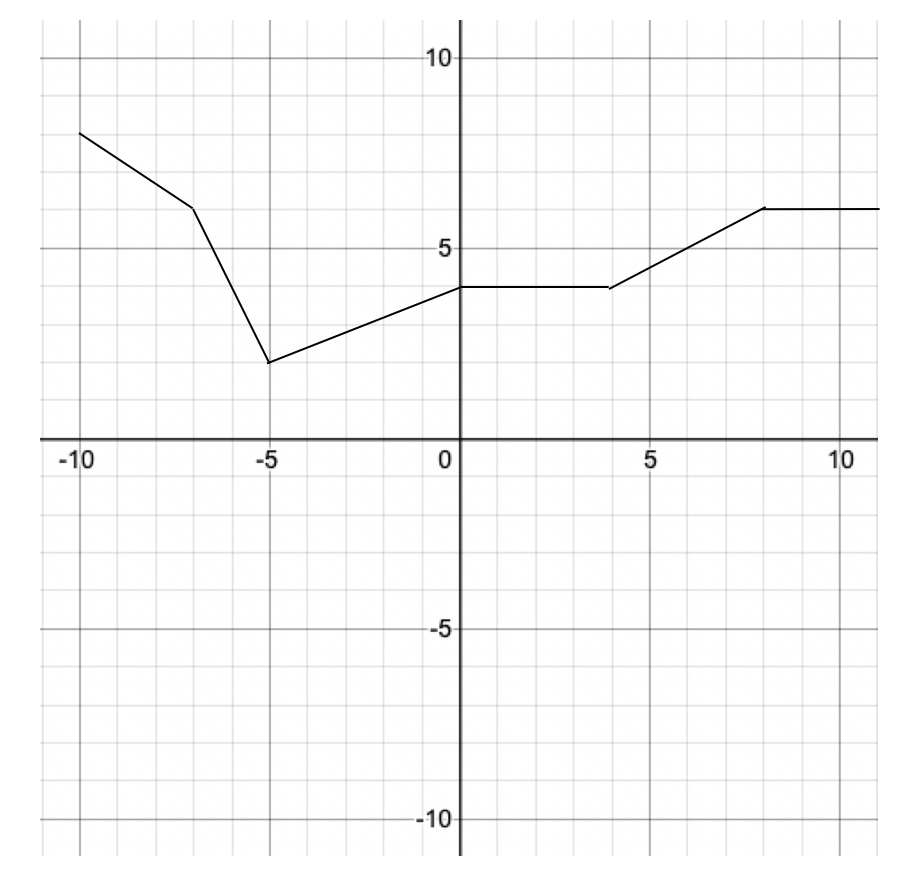
The function f(x) is shown above for all the numbers within its domain. What is the value of the function when it is at its minimum?
4
-5
2
0
2
When you're interpreting graphed functions, it is important to recognize that the value of the function itself is shown on the y-axis (the vertical axis) while the horizontal axis displays the x-values that are inputs to the function. So here when you're asked for the minimum value of the function, you're looking for the lowest point, which happens at the point (-5, 2). And since the value of the function is the y-coordinate at that point, you can answer 2 as the correct answer.


All SAT Mathematics Resources

