SAT II Math II : Representing Data
Study concepts, example questions & explanations for SAT II Math II


All SAT II Math II Resources
Example Questions
Example Question #1 : Representing Data
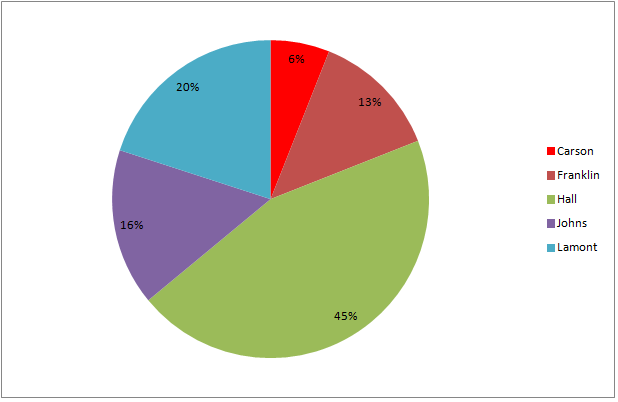
The above graph represents the results of a general election for mayor of Kingston.
If 1,658 people voted for Carson, then which comes closest to the number of people who voted for Franklin?


The ratio of Franklin's percent of the vote to Carson's is the same as the number of votes for Franklin to those for Carson. From the information in the graph, setting 

Multiply both sides by 1,658 and solve:


The closest estimate would be 3,600 votes.
Example Question #1 : Representing Data
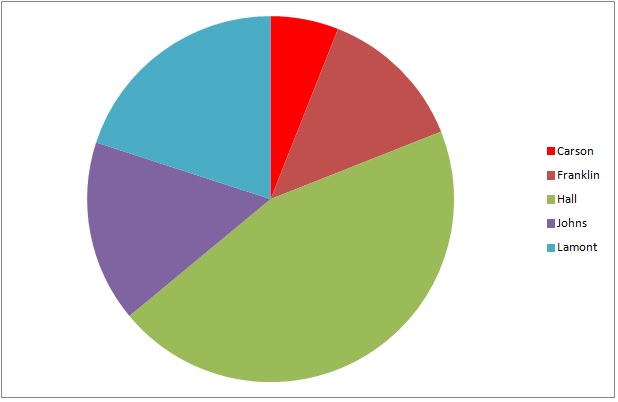
The above graph represents the results of a general election for mayor of Kingston.
If 8,349 people voted, which of the following numbers is closest to the number of voters who did not vote for the winning candidate?


The four wedges representing the four nonwinners - all except the largest wedge, which is green - together make up slightly more than half the circle. 55% is a good estimate, and 55% of 8,349 is equal to

The best estimate of the given choices is 4,600.


Certified Tutor

All SAT II Math II Resources

