ISEE Middle Level Quantitative : Data Analysis and Probability
Study concepts, example questions & explanations for ISEE Middle Level Quantitative


All ISEE Middle Level Quantitative Resources
Example Questions
Example Question #31 : Outcomes
A pair of fair six-sided dice are thrown, and the sum of the numbers facing upward is noted. What is the probability that the sum will be 7 or less?


There are 
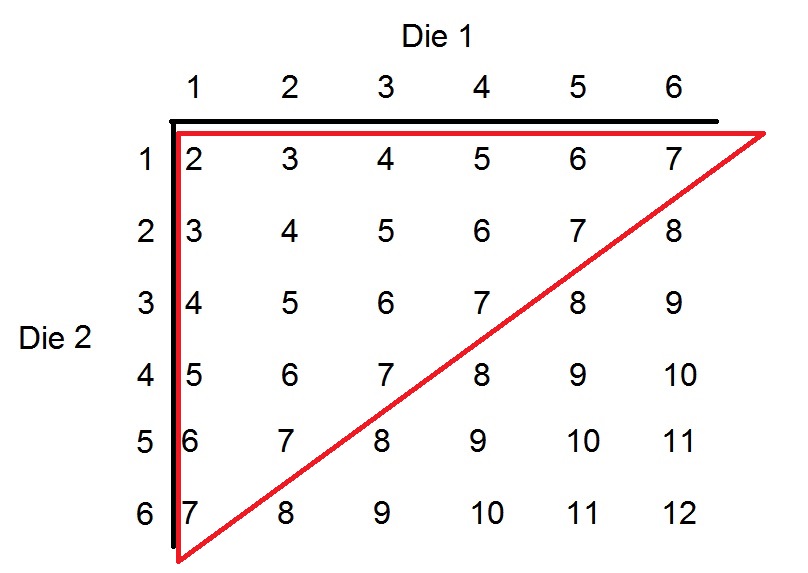
There are 21 ways out of 36 to roll a sum of 7 or less, making the probability of this outcome 
Example Question #32 : Outcomes
Each of a set of balls is marked with a number; one ball is marked with a "1", two balls are marked with a "2". and so forth up to ten balls with a "10". The odd-numbered balls are placed in Box 1; the rest, in Box 2. The boxes contain no other balls.
Which is the greater quantity?
(a) The probability that a ball randomly drawn from Box 1 will be marked "1".
(b) The probability that a ball randomly drawn from Box 2 will be marked "2".
(a) is the greater quantity
(a) and (b) are equal
(b) is the greater quantity
It is impossible to determine which is greater from the information given
(b) is the greater quantity
Box 1 contains the odd-numbered balls, of which there are

One of these balls is marked with a "1", making the probability of drawing this ball 
Box 2 contains the even-numbered balls, of which there are

Two of these balls are marked with a "2", making the probability of drawing such a ball 
Between two fractions with the same numerator, the one with the lesser denominator is the greater, so 
Example Question #33 : Outcomes
Each of a set of balls is marked with a number; one ball is marked with a "1", two balls are marked with a "2". and so forth up to ten balls with a "10". The odd-numbered balls are placed in Box 1; the rest, in Box 2.
Which is the greater quantity?
(a) The probability that a ball randomly drawn from Box 1 will be marked "9".
(b) The probability that a ball randomly drawn from Box 2 will be marked "10".
(a) and (b) are equal
It is impossible to determine which is greater from the information given
(a) is the greater quantity
(b) is the greater quantity
(a) is the greater quantity
Box 1 contains the odd-numbered balls, of which there are

Nine of these balls are marked with a "9", making the probability of drawing one of these balls 
Box 2 contains the even-numbered balls, of which there are

Ten of these balls are marked with a "10", making the probability of drawing such a ball 
We can compare these fractions by expressing both with a common denominator.  = 75")

and

The probability that a ball randomly drawn from Box 1 will be marked "9" is the greater.
Example Question #34 : Outcomes
A large box contains some balls, each marked with a whole number from "1" to "10". Each number is represented by one red ball. In addition, each prime number is represented by one green ball, and each composite number is represented by one blue ball. A yellow ball, which is not marked with a number, is also included.
Give the probability that a randomly-drawn ball will be blue.


Each number will be represented by one red ball, so there will be ten red balls in the box.
The prime numbers - the numbers that have only 1 and themselves as factors - are 2, 3, 5, and 7, so there will be four green balls.
The composite numbers - the numbers that have more than two factors - are 4, 6, 8, 9, and 10, so there will be five blue balls.
Note that 1 is neither prime nor composite.
Including the unmarked yellow ball, the total number of balls is 

Example Question #31 : Data Analysis And Probability
John has a standard deck of 53 cards, which includes the joker. Mary has two decks of 52 cards, shuffled together without their jokers. John and Mary each select a card at random from their decks. Which is the greater quantity?
(a) The probability that John will draw a diamond
(b) The probability that Mary will draw a diamond
It is impossible to determine which is greater from the information given
(a) is the greater quantity
(a) and (b) are equal
(b) is the greater quantity
(b) is the greater quantity
One fourth of the cards in a standard deck of 52, not including the joker, will be diamonds; if two standard decks are shuffled together, then one fourth of those cards will be diamonds. The probability that Mary will draw a diamond is therefore 
However, when the joker is added to John's deck, there are more cards, but just as many diamonds. Therefore, the probability of John drawing a diamond must decrease to slightly less than 
Example Question #32 : Data Analysis And Probability
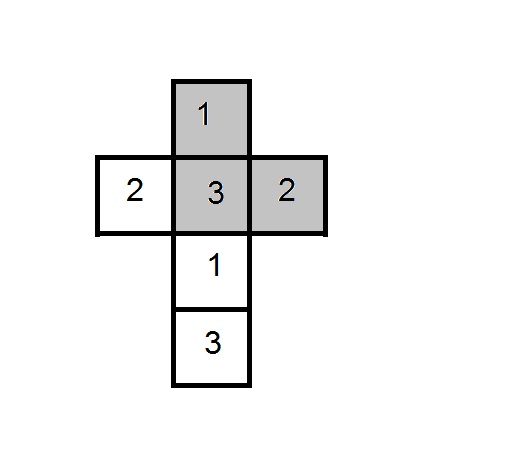
The six faces of a die are shown in the fold-out diagram above; this die and an identical one are tossed.
Which is the greater quantity?
(a) The probability that the dice land with sides of the same color facing upward
(b) The probability that the dice land with sides of different colors facing upward
(a) and (b) are equal
(a) is the greater quantity
(b) is the greater quantity
It is impossible to determine which is greater from the information given
(a) and (b) are equal
As seen from the table below, out of the thirty-six equally probable rolls, eighteen result in the same color facing upward on both dice (indicated by an "S"); eighteen result in different colors facing upward (indicated by a "D").
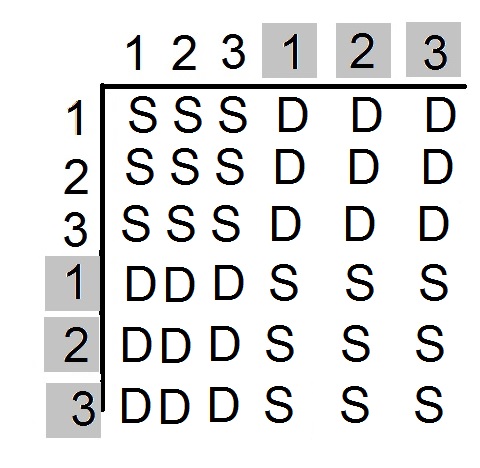
The events occur with the same frequency, so they also occur with the same probability.
Example Question #33 : How To Find The Probability Of An Outcome
The six faces of a fair die are shown in the fold-out diagram above; this die and an identical one are tossed.
Which is the greater quantity?
(a) The probability that the sum of the numbers facing upward is even
(b) The probability that the sum of the numbers facing upward is odd
(b) is the greater quantity
(a) is the greater quantity
(a) and (b) are equal
It is impossible to determine which is greater from the information given
(a) is the greater quantity
As seen from the table below, out of the thirty-six equally probable rolls, twenty result in an even sum (these are set apart with red squares), and sixteen result in an odd sum.
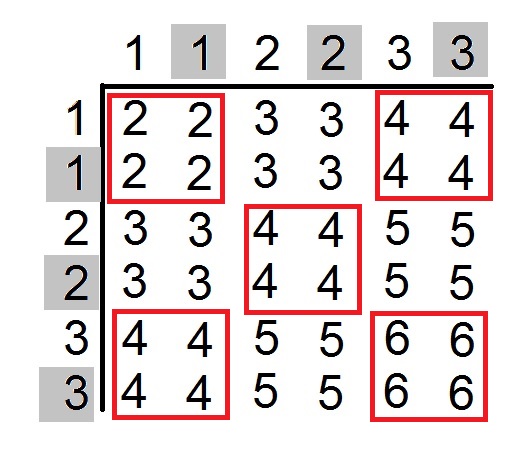
Since even sums happen with greater frequency, the probability of an even sum is greater.
Example Question #38 : Outcomes
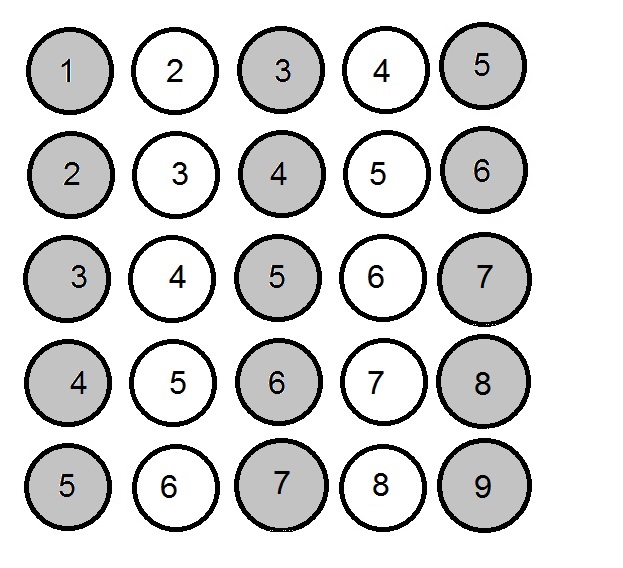
The above diagram shows a set of balls. The odd-numbered balls are placed in Box A; the even-numbered balls, in Box B. Which is the greater quantity?
(a) The probability that a ball randomly drawn from Box A will be white.
(b) The probability that a ball randomly drawn from Box B will be white.
(a) is the greater quantity
It is impossible to determine which is greater from the information given
(b) is the greater quantity
(a) and (b) are equal
(b) is the greater quantity
The diagram below shows how the balls are separated. 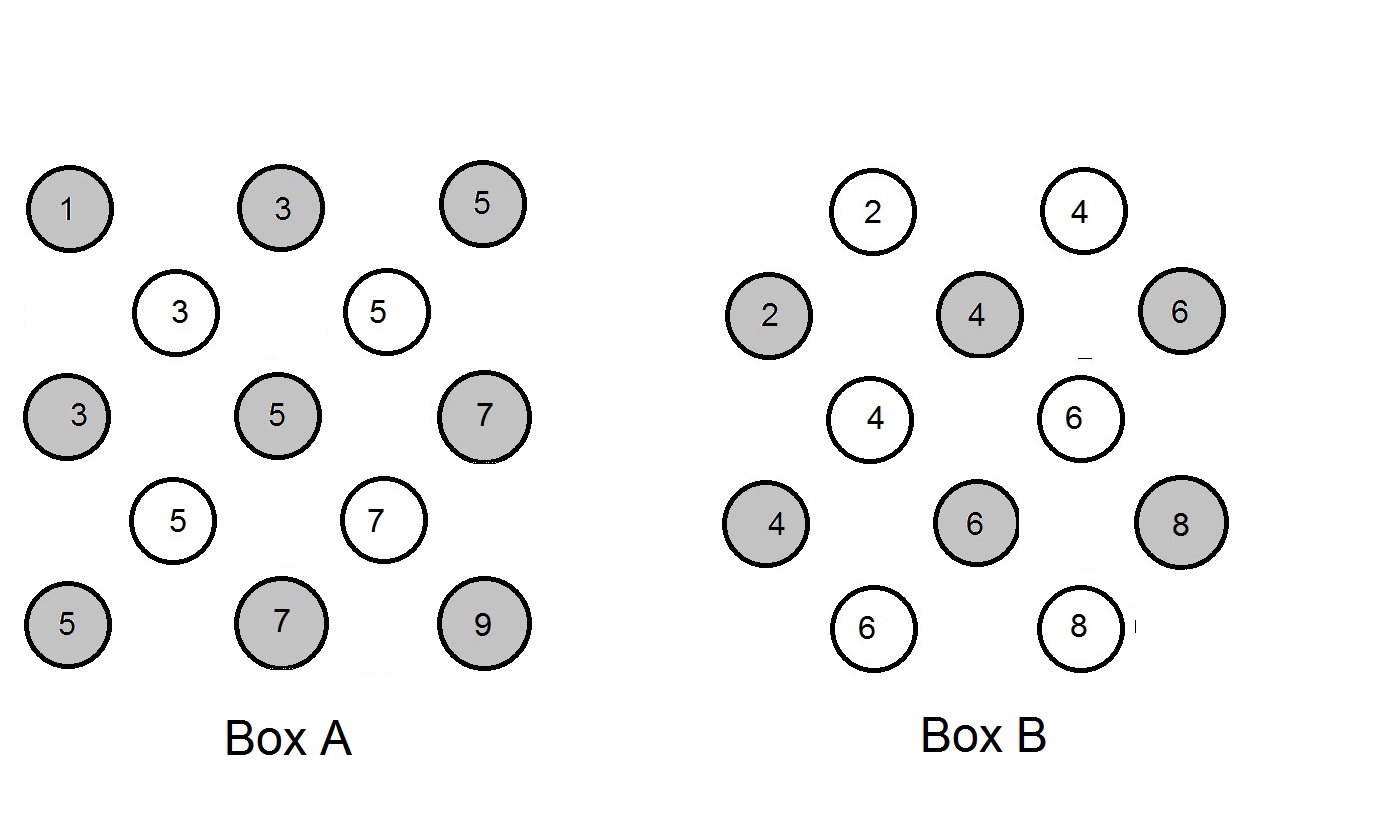
Box A contains 13 balls, of which 4 are white; the probability of a random draw from this box resulting in the draw of a white ball is 
Box B contains 12 balls, of which 6 are white; the probability of a random draw from this box resulting in the draw of a white ball is 
Rewriting the probabilities in terms of a common denominator:


Example Question #39 : Outcomes
Two fair six-sided dice are thrown. What is the probability that the product is greater than or equal to


The rolls that yield a product greater than or equal to 20 are:
 &20 \\ (4,6) &24 \\ (5,4) &20 \\ (5,5) & 25\\ (5,6) & 30\\ (6,4) &24 \\ (6,5) &30 \\ (6,6) &36 \end{matrix}")
These are 8 out of 36 rolls, so the probability of getting one of them is

Example Question #251 : Isee Middle Level (Grades 7 8) Quantitative Reasoning
Define:
Universal set 


If all of the natural numbers were to be placed in their appropriate places in the above Venn diagram, which of the following would be placed in the gray region?


The gray region is the region outside both 

1,565 and 3,890 can be eliminated as choices as each is divisible by 5: the former ends in 5 and the latter ends in 0.
7,431 and 3,966 can be eliminated as each is divisible by 3: 

7,916 is not divisible by 5 as it ends in 6; it is not divisible by 3 as 

Certified Tutor


All ISEE Middle Level Quantitative Resources

