ISEE Middle Level Math : Data Analysis and Probability
Study concepts, example questions & explanations for ISEE Middle Level Math


All ISEE Middle Level Math Resources
Example Questions
Example Question #99 : How To Find Range
Use the following set to answer the question:

Find the range.


To find the range, we will find the smallest and the largest number. Then, we wll find the difference of those two numbers. So, given the set

we can see the smallest number is 1 and the largest number is 9. Now, we will find the difference. We get

Therefore, the range of the data set is 8.
Example Question #100 : How To Find Range
Use the following data set to answer the question:

Find the range.


To find the range, we will find the smallest number and the largest number. Then, we will find the difference of the two numbers.
So, given the data set

we can see the smallest number is 1 and the largest number is 9. Now, we will find the difference. We get

Therefore, the range of the data set is 8.
Example Question #101 : How To Find Range
Use the following data set to answer the question:

Find the range.


To find the range of a data set, we will find the smallest number and the largest number. Then, we will find the difference of those two numbers.
So, given the set

we can see the smallest number is 2 and the largest number is 10. Now, we will find the difference. We get

Therefore, the range of this data set is 8.
Example Question #102 : How To Find Range
Use the following data set to answer the question:

Find the range.


To find the range of a data set, we will first find the smallest and the largest number within the set. Then, we will find the difference of those two numbers.
So, given the data set

we can see the smallest number is 2 and the largest number is 9. So, we will find the difference. We get

Therefore, the range of the data set is 7.
Example Question #103 : How To Find Range
Use the following data set to answer the question:

Find the range.


To find the range of a data set, we will first find the smallest and the largest number within the set. Then, we will find the difference of those two numbers.
So, given the set

We can see the smallest number is 4 and the largest number is 9. Now, we will find the difference. So,

Therefore, the range of the data set is 5.
Example Question #104 : How To Find Range
Determine the range of the numbers provided:


The range of a set of numbers is the difference between the highest and lowest numbers.
The largest number is:

The smallest number is:

Subtract the numbers.
 = 60")
The answer is:

Example Question #105 : How To Find Range
Use the following data set to answer the question:

Find the range.


To find the range of a data set, we will find the smallest number and the largest number. Then, we will find the difference of those two numbers.
So, given the data set

we can see the smallest number is 4 and the largest number is 14. Now, we will find the difference. We get

Therefore, the range of the data set is 10.
Example Question #1 : Tables
Below is the list of candidates for Student Council president, along with the number of votes each won:

What percent of the students voted for Jarrow (nearest tenth)?


Example Question #1 : How To Find The Answer From A Table
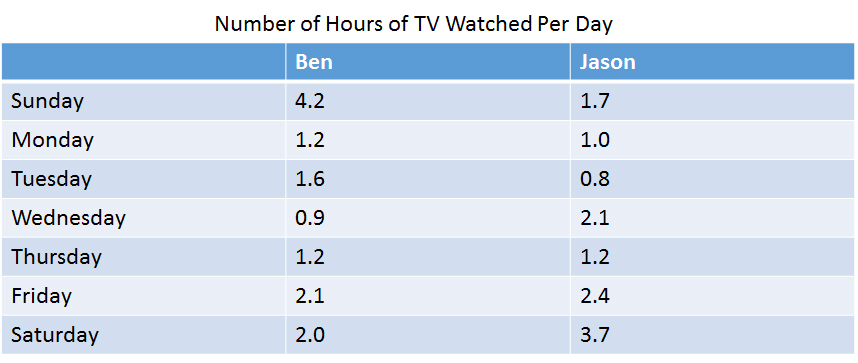
Consider the table. On which day of the week is the combined total of Ben and Jason's TV viewing the greatest?
Saturday
Thursday
Friday
Sunday
Sunday
On Sundays, Ben and Jason watch a total of 5.9 hours of TV:

They watch less TV on all other days: On Saturdays they watch 5.7 hours, on Fridays they watch 4.5 hours, and on Thursdays they watch 2.4 hours.
Example Question #201 : Data Analysis And Probability
Below is the list of candidates for Student Council president, along with the number of votes each won:

What percent of the votes (nearest whole number) were won by the third-place finisher?


Third place was won by Harris, who won 64 out of 


Certified Tutor

Certified Tutor

All ISEE Middle Level Math Resources

