All GRE Math Resources
Example Questions
Example Question #1 : Venn Diagrams
In a class, there are 15 students who like chocolate. 13 students like vanilla. 10 students like neither. If there are 35 people in the class, how many students like chocolate and vanilla?
3
10
2
25
13
3
In order to find the intersection of chocolate and vanilla, it is easiest to make a Venn Diagram. The outside of the Venn Diagram is 10, and the total of the entire diagram must equal 35. Therefore the two circles of the Venn Diagram including just chocolate, just vanilla and the intersection must equal 25, with the just chocolate plus intersection side equalling 15 and the just vanilla plus intersection side equalling 13.
We know:
(A U B) = A + B – (A ∩ B)
We have found that (A U B) = 25 and we are trying to find (A ∩ B). Plug in A and B
25 = 15 + 13 – (A ∩ B) = 28 – (A ∩ B)
or – (A ∩ B) = –3
(A ∩ B) = 3
Example Question #2 : Venn Diagrams
A given company has 1500 employees. Of those employees, 800 are computer science majors. 25% of those computer science majors are also mathematics majors. That group of computer science/math dual majors makes up one third of the total mathematics majors. How many employees have majors other than computer science and mathematics?
None of the other answers.
Refer to the following Venn Diagram:
If 25% of the 800 CS students are also mathematics students, the number of students sharing these majors is 800 * 0.25 or 200 students. Furthermore, if this represents one third of the total of math students, we then know:
Math students * 1/3 = 200 or (1/3)M = 200
Solving for M we get 600. This means that the number of students that are ONLY math students is 400.
Looking at our diagram above, we must be careful not to "double add" the intersection. The easiest way to do this is to take the intersection and add to it the number of CS-only and math-only students: 600 + 200 + 400 = 1200. This number represents the total number of students that have either a math or CS major (that is, the number of students in the union of the two sets). This leaves 1500 – 1200 or 300 students.
Example Question #3 : Venn Diagrams
In a population of cats, 10% are tabby colored, 5% are pregnant, and 3% are both tabby and pregnant. What is the probability that a cat is tabby but not pregnant?
Probability (tabby but not pregnant)
= Prob (tabby) – Prob (tabby and pregnant)
= 10% - 3%
= 7%
Example Question #2 : How To Find The Intersection Of A Venn Diagram
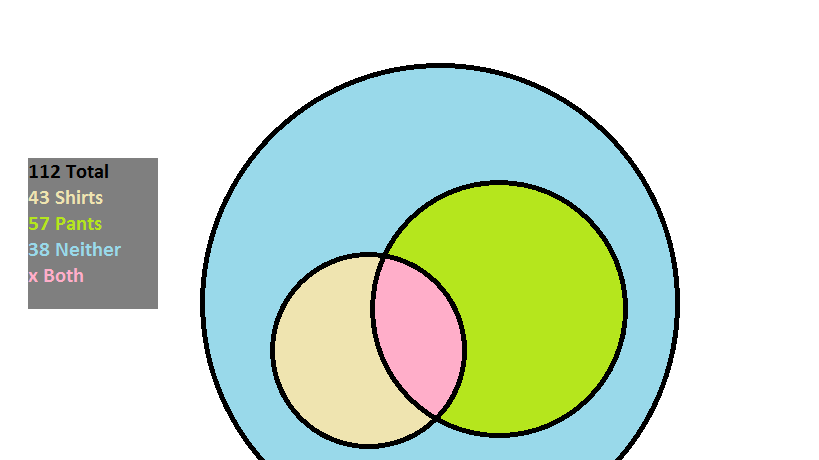
At an overpriced department store there are 


A way of solving this problem is by drawing a Venn diagram based on what is known:

There are 
The amount of individuals that purchased something is given as:
The reason that the number of shoppers that bought both is subtracted is so that it is not counted twice when the customers that bought pants and the customers that bought shirts are added together.
Since 
The amount that bought both then is:
Example Question #2 : How To Find The Intersection Of A Venn Diagram
In a school, 70 students are taking classes. 35 of them will be taking Accounting and 20 of them will be taking Economics. 7 of them are taking both of these classes. How many of the students are not in either class?
When you add both class rosters you get a total of 55 students

You must subtract the 7 that are in both because they are counted twice in the 55

The total in neither class will be the total students minus the adjusted enrollment in both classes

Example Question #445 : Gre Quantitative Reasoning
There are 15,000 students at college X. Of those students, 1,700 are taking both ethics and metaphysics this semester. There are 2,200 total students taking ethics. 9,500 students are taking neither of these classes. How many students are taking metaphysics this term?
3800
3300
None of the other answers.
1600
5,000
5,000
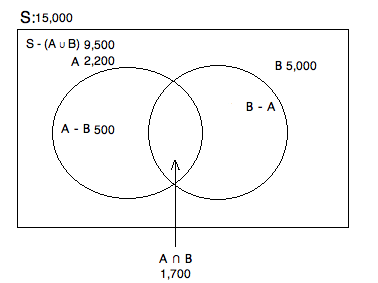
The easiest way to understand this problem is to draw a Venn Diagram:
S = Total number of students
A = Total students taking ethics
B = Total students taking metaphysics
A - B = Students taking only ethics
B - A = Students taking only metaphysics
A ∪ B = The total students taking either ethics or metaphysics
A ∩ B = The total students taking both ethics and metaphysics
We know there are 15,000 total and that 9,500 are taking neither class. Therefore, we know that 15,000 - 9,500 = 5,500 are taking at least one of the classes. Based on our prompt, we know that there are 1,700 taking both and that 2,200 are taking ethics. To fiind out how many are taking ONLY ethics, we have to subtract off the amount that are taking ethics and metaphysics. Hence, 2,200 - 1,700 = 500. Finally, if we know that there are 5,500 taking at at least one of these classes, we want to get rid of that portion taking ethics. This will leave us with those who are taking at least metaphysics (regardless of whether or not they are taking ethics): 5,500 - 500 = 5,000.
Example Question #1 : Venn Diagrams
In a class of 100 students, 43 play basketball and 37 play baseball. 9 students play both. How many students do not play either sport?
29
not enough information to answer the question
20
71
38
29
In order to determine how many students are not enrolled in a sport, we must first determine how many students are. The simplest way to do this is to begin by adding the students of both sports together.
43 + 37 = 80
But wait! 9 of those students are play both baseball and basketball. To avoid double counting these students, subtract 9 from the total.
80 – 9 = 71
Now we know 71 students play sports. If there are 100 students, all that's left to do is subtract.
100 – 71 = 29
29 students do not play basketball or baseball.
Example Question #4 : Venn Diagrams
There are 


You could represent this question in the following Venn Diagram:

We know that the two circles must contain a total of 
This is the simple answer to this question! You do not need to compute the overlap at all, as you are merely looking for the contents of the two circles.
Example Question #1 : Data Analysis
A jar contains 10 red marbles, 4 white marbles, and 2 blue marbles. Two are drawn in sequence, not replacing after each draw.
Quantity A
The probability of drawing two red marbles
Quantity B
The probability of drawing exactly one blue marble.
The relationship cannot be determined from the information given.
Quantity A is greater.
Quantity B is greater.
The quantities are equal.
Quantity A is greater.
Note that there are 16 total marbles. A is simply a set of sequential events. On the first, you have 10/16 chances to draw a red. Supposing this red is not replaced, the chance of drawing a second red will be 9/15; therefore, the probability of A is (10/16) * (9/15) = 0.375. Event B is translated into 2 events: Blue + (White or Red) or (White or Red) + Blue. The probabilities of each of these events, added together would be (2/16) * (14/15) + (14/16) * (2/15) = 0.2333333333; therefore, A is more probable.
Example Question #1 : Probability
In a bowl containing 10 marbles, 5 are blue and 5 are pink. If 2 marbles are picked randomly, what is the probability that the 2 marbles will not both be pink?
2/9
5/6
7/8
7/9
7/9
To solve this question, you can solve for the probability of choosing 2 marbles that are pink and subtracting that from 1 to obtain the probability of selecting any variation of marbles that are not both pink.
The probability of picking 2 marbles that are both pink would be the product of the probability of choosing the first pink marble multiplied by the probability of choosing a second pink marble from the remaining marbles in the mix.
This would be 1/2 * 4/9 = 2/9.
To obtain the probability that is asked, simply compute 1 – (2/9) = 7/9.
The probability that the 2 randomly chosen marbles are not both pink is 7/9.
All GRE Math Resources


