Common Core: High School - Statistics and Probability : Summarize Interpret Categorical Data in Two-Way Frequency Tables: CCSS.Math.Content.HSS-ID.B.5
Study concepts, example questions & explanations for Common Core: High School - Statistics and Probability


All Common Core: High School - Statistics and Probability Resources
Example Questions
Example Question #61 : High School: Statistics & Probability
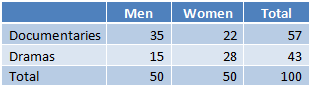
Suppose a social scientist wants to know the effects of gender upon film preferences. She samples fifty men and women and asks them to mark their preference between to genres: documentaries and dramas. She then constructs a two-way frequency table as shown:
What is the relative probability of men who prefer dramas?


This question requires us to calculate a relative probability from a two-way frequency chart. Before we can calculate this probability, we need to consider the composition of these tables. The numbers located within the table are not quantitative (i.e. they simply represent the number of times a particular phenomenon occurs). These tables are made up of marginal and joint frequencies. Marginal frequencies occur in the columns and rows labeled as “titles,’” while the joint frequencies are embedded in the table. Let’s observe the frequency table given in the question:
Relative probabilities are calculated by dividing the marginal and joint frequencies by the total in the table. If we divide each frequency by the total frequency, then we can create the following table:

In this table we can see that the relative probability of men who like dramas is:


This can also be solved by graphing the relative probabilities on a stacked bar chart such as the one shown below:

Example Question #62 : High School: Statistics & Probability
Suppose a social scientist wants to know the effects of gender upon film preferences. She samples fifty men and women and asks them to mark their preference between to genres: documentaries and dramas. She then constructs a two-way frequency table as shown:
What is the conditional probability of men who like documentaries?


This question requires us to calculate a conditional probability from a two-way frequency chart. Before we can calculate this probability, we need to consider the composition of these tables. The numbers located within the table are not quantitative (i.e. they simply represent the number of times a particular phenomenon occurs). These tables are made up of marginal and joint frequencies. Marginal frequencies occur in the columns and rows labeled as “titles,’” while the joint frequencies are embedded in the table. Let’s observe the frequency table given in the question:
Conditional probabilities are calculated by dividing a joint frequency by a marginal frequency. In this case we need to divide the number of men who like documentaries by the total number of men in the study (i.e. the two conditions we know).


Example Question #1 : Summarize Interpret Categorical Data In Two Way Frequency Tables: Ccss.Math.Content.Hss Id.B.5
Suppose a social scientist wants to know the effects of gender upon film preferences. She samples fifty men and women and asks them to mark their preference between to genres: documentaries and dramas. She then constructs a two-way frequency table as shown:
What is the relative probability of men who prefer dramas?


This question requires us to calculate a relative probability from a two-way frequency chart. Before we can calculate this probability, we need to consider the composition of these tables. The numbers located within the table are not quantitative (i.e. they simply represent the number of times a particular phenomenon occurs). These tables are made up of marginal and joint frequencies. Marginal frequencies occur in the columns and rows labeled as “titles,’” while the joint frequencies are embedded in the table. Let’s observe the frequency table given in the question:
Relative probabilities are calculated by dividing the marginal and joint frequencies by the total in the table. If we divide each frequency by the total frequency, then we can create the following table:
In this table, we can see that the relative probability of men who like dramas is:
This can also be solved by graphing the relative probabilities on a stacked bar chart such as the one shown below:
Example Question #2 : Summarize Interpret Categorical Data In Two Way Frequency Tables: Ccss.Math.Content.Hss Id.B.5
Suppose a social scientist wants to know the effects of gender upon film preferences. She samples fifty men and women and asks them to mark their preference between to genres: documentaries and dramas. She then constructs a two-way frequency table as shown:
What is the conditional probability of men who like documentaries?

This question requires us to calculate a conditional probability from a two-way frequency chart. Before we can calculate this probability, we need to consider the composition of these tables. The numbers located within the table are not quantitative (i.e. they simply represent the number of times a particular phenomenon occurs). These tables are made up of marginal and joint frequencies. Marginal frequencies occur in the columns and rows labeled as “titles,’” while the joint frequencies are embedded in the table. Let’s observe the frequency table given in the question:
Conditional probabilities are calculated by dividing a joint frequency by a marginal frequency. In this case we need to divide the number of men who like documentaries by the total number of men in the study (i.e. the two conditions we know).
Example Question #5 : Summarize Interpret Categorical Data In Two Way Frequency Tables: Ccss.Math.Content.Hss Id.B.5
Suppose a social scientist wants to know the effects of gender upon film preferences. She samples fifty men and women and asks them to mark their preference between to genres: documentaries and dramas. She then constructs a two-way frequency table as shown:
What is the relative probability of men who prefer dramas?
This question requires us to calculate a relative probability from a two-way frequency chart. Before we can calculate this probability, we need to consider the composition of these tables. The numbers located within the table are not quantitative (i.e. they simply represent the number of times a particular phenomenon occurs). These tables are made up of marginal and joint frequencies. Marginal frequencies occur in the columns and rows labeled as “titles,’” while the joint frequencies are embedded in the table. Let’s observe the frequency table given in the question:
Relative probabilities are calculated by dividing the marginal and joint frequencies by the total in the table. If we divide each frequency by the total frequency, then we can create the following table:
In this table we can see that the relative probability of men who like dramas is:
This can also be solved by graphing the relative probabilities on a stacked bar chart such as the one shown below:
Example Question #6 : Summarize Interpret Categorical Data In Two Way Frequency Tables: Ccss.Math.Content.Hss Id.B.5
Suppose a social scientist wants to know the effects of gender upon film preferences. She samples fifty men and women and asks them to mark their preference between to genres: documentaries and dramas. She then constructs a two-way frequency table as shown:

What is the relative probability of men who prefer dramas?


This question requires us to calculate a relative probability from a two-way frequency chart. Before we can calculate this probability, we need to consider the composition of these tables. The numbers located within the table are not quantitative (i.e. they simply represent the number of times a particular phenomenon occurs). These tables are made up of marginal and joint frequencies. Marginal frequencies occur in the columns and rows labeled as “titles,’” while the joint frequencies are embedded in the table. Let’s observe the frequency table given in the question:

Relative probabilities are calculated by dividing the marginal and joint frequencies by the total in the table. If we divide each frequency by the total frequency, then we can create the following table:

In this table, we can see that the relative probability of men who like dramas is:

This can also be solved by graphing the relative probabilities on a stacked bar chart such as the one shown below:

Example Question #7 : Summarize Interpret Categorical Data In Two Way Frequency Tables: Ccss.Math.Content.Hss Id.B.5
Suppose a social scientist wants to know the effects of gender upon film preferences. She samples fifty men and women and asks them to mark their preference between to genres: documentaries and dramas. She then constructs a two-way frequency table as shown:

What is the relative probability of men who prefer dramas?


This question requires us to calculate a relative probability from a two-way frequency chart. Before we can calculate this probability, we need to consider the composition of these tables. The numbers located within the table are not quantitative (i.e. they simply represent the number of times a particular phenomenon occurs). These tables are made up of marginal and joint frequencies. Marginal frequencies occur in the columns and rows labeled as “titles,’” while the joint frequencies are embedded in the table. Let’s observe the frequency table given in the question:

Relative probabilities are calculated by dividing the marginal and joint frequencies by the total in the table. If we divide each frequency by the total frequency, then we can create the following table:

In this table, we can see that the relative probability of men who like dramas is:

This can also be solved by graphing the relative probabilities on a stacked bar chart such as the one shown below:

Example Question #8 : Summarize Interpret Categorical Data In Two Way Frequency Tables: Ccss.Math.Content.Hss Id.B.5
Suppose a social scientist wants to know the effects of gender upon film preferences. She samples fifty men and women and asks them to mark their preference between to genres: documentaries and dramas. She then constructs a two-way frequency table as shown:

What is the relative probability of men who prefer dramas?


This question requires us to calculate a relative probability from a two-way frequency chart. Before we can calculate this probability, we need to consider the composition of these tables. The numbers located within the table are not quantitative (i.e. they simply represent the number of times a particular phenomenon occurs). These tables are made up of marginal and joint frequencies. Marginal frequencies occur in the columns and rows labeled as “titles,’” while the joint frequencies are embedded in the table. Let’s observe the frequency table given in the question:

Relative probabilities are calculated by dividing the marginal and joint frequencies by the total in the table. If we divide each frequency by the total frequency, then we can create the following table:

In this table, we can see that the relative probability of men who like dramas is:

This can also be solved by graphing the relative probabilities on a stacked bar chart such as the one shown below:

Example Question #9 : Summarize Interpret Categorical Data In Two Way Frequency Tables: Ccss.Math.Content.Hss Id.B.5
Suppose a social scientist wants to know the effects of gender upon film preferences. She samples fifty men and women and asks them to mark their preference between to genres: documentaries and dramas. She then constructs a two-way frequency table as shown:

What is the relative probability of men who prefer dramas?


This question requires us to calculate a relative probability from a two-way frequency chart. Before we can calculate this probability, we need to consider the composition of these tables. The numbers located within the table are not quantitative (i.e. they simply represent the number of times a particular phenomenon occurs). These tables are made up of marginal and joint frequencies. Marginal frequencies occur in the columns and rows labeled as “titles,’” while the joint frequencies are embedded in the table. Let’s observe the frequency table given in the question:

Relative probabilities are calculated by dividing the marginal and joint frequencies by the total in the table. If we divide each frequency by the total frequency, then we can create the following table:

In this table, we can see that the relative probability of men who like dramas is:

This can also be solved by graphing the relative probabilities on a stacked bar chart such as the one shown below:

Example Question #10 : Summarize Interpret Categorical Data In Two Way Frequency Tables: Ccss.Math.Content.Hss Id.B.5
Suppose a social scientist wants to know the effects of gender upon film preferences. She samples fifty men and women and asks them to mark their preference between to genres: documentaries and dramas. She then constructs a two-way frequency table as shown:

What is the relative probability of men who prefer dramas?


This question requires us to calculate a relative probability from a two-way frequency chart. Before we can calculate this probability, we need to consider the composition of these tables. The numbers located within the table are not quantitative (i.e. they simply represent the number of times a particular phenomenon occurs). These tables are made up of marginal and joint frequencies. Marginal frequencies occur in the columns and rows labeled as “titles,’” while the joint frequencies are embedded in the table. Let’s observe the frequency table given in the question:

Relative probabilities are calculated by dividing the marginal and joint frequencies by the total in the table. If we divide each frequency by the total frequency, then we can create the following table:

In this table, we can see that the relative probability of men who like dramas is:

This can also be solved by graphing the relative probabilities on a stacked bar chart such as the one shown below:


Certified Tutor


All Common Core: High School - Statistics and Probability Resources

