Common Core: 6th Grade Math : Report the Number of Observations: CCSS.Math.Content.6.SP.B.5a
Study concepts, example questions & explanations for Common Core: 6th Grade Math


All Common Core: 6th Grade Math Resources
Example Questions
Example Question #41 : Statistics & Probability
Miss. Little wants to know how many pairs of shoes each of her students owns. This data is displayed in the provided dot plot. Based on this dot plot, how many observations were made?
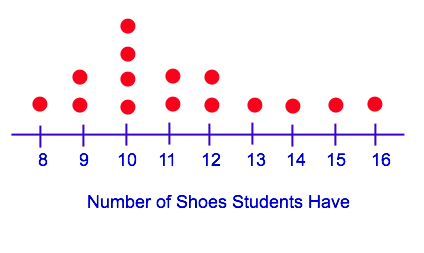


For this plot, the number of observations made represents the number of students that participated in the survey. Each dot represents one student, so we can count up the number of dots in the plot to determine the number of observations that were made.
If done correctly, you should have counted 

Example Question #1 : Report The Number Of Observations: Ccss.Math.Content.6.Sp.B.5a
Miss. Little wants to know how many pairs of shoes each of her students owns. This data is displayed in the provided dot plot. Based on this dot plot, how many observations were made?
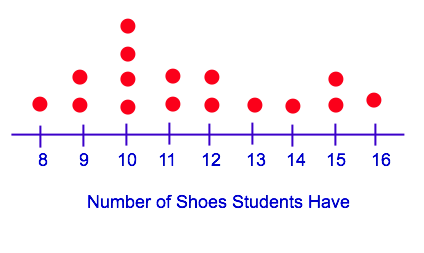


For this plot, the number of observations made represents the number of students that participated in the survey. Each dot represents one student, so we can count up the number of dots in the plot to determine the number of observations that were made.
If done correctly, you should have counted 

Example Question #1472 : Grade 6
An Environmental Science Class wanted to look at the average temperature for each day this past month. This data is displayed in the provided chart. Based on this dot plot, how many observations were made?
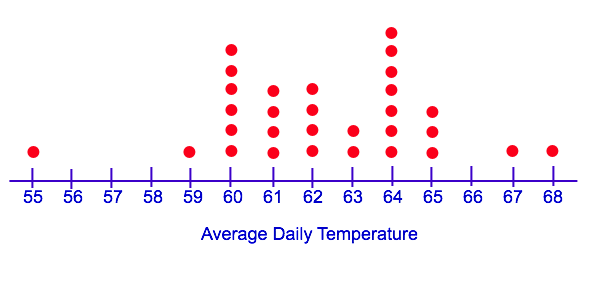


For this plot, the number of observations made represents the number of days that the temperature was tracked. Each dot represents one day, so we can count up the number of dots in the plot to determine the number of observations that were made.
If done correctly, you should have counted 

Example Question #4 : Report The Number Of Observations: Ccss.Math.Content.6.Sp.B.5a
An Environmental Science Class wanted to look at the average temperature for each day this past month. This data is displayed in the provided chart. Based on this dot plot, how many observations were made?


For this plot, the number of observations made represents the number of days that the temperature was tracked. Each dot represents one day, so we can count up the number of dots in the plot to determine the number of observations that were made.
If done correctly, you should have counted 

Example Question #1 : Report The Number Of Observations: Ccss.Math.Content.6.Sp.B.5a
An Environmental Science Class wanted to look at the average temperature for each day this past month. This data is displayed in the provided chart. Based on this histogram, how many observations were made?


For this plot, the number of observations made represents the number of days that the temperature was tracked. Each bar goes up to a certain number of days, so we can add up the height of each bar to determine the number of observations that were made.

If done correctly, we should have found that 
Example Question #6 : Report The Number Of Observations: Ccss.Math.Content.6.Sp.B.5a
Miss. Little wants to know how many pairs of shoes each of her students owns. This data is displayed in the provided histogram. Based on this histogram, how many observations were made?


For this plot, the number of observations made represents the number of students that participated in the survey. Each bar goes up to a certain number of students, so we can add up the height of each bar to determine the number of observations that were made.

If done correctly, we should have found that 
Example Question #1 : Report The Number Of Observations: Ccss.Math.Content.6.Sp.B.5a
An Environmental Science Class wanted to look at the average temperature for each day this past month. This data is displayed in the provided chart. Based on this histogram, how many observations were made?


For this plot, the number of observations made represents the number of days that the temperature was tracked. Each bar goes up to a certain number of days, so we can add up the height of each bar to determine the number of observations that were made.

If done correctly, we should have found that 
Example Question #1 : Report The Number Of Observations: Ccss.Math.Content.6.Sp.B.5a
Mr. Smith wants to know how tall all of his students are, in inches. He asked each of his students to write down their height. This data is displayed in the provided chart. Based on this dot plot, how many observations were made?


For this plot, the number of observations made represents the number of students that participated in the survey. Each dot represents one student, so we can count up the number of dots in the plot to determine the number of observations that were made.
If done correctly, you should have counted 

Example Question #10 : Report The Number Of Observations: Ccss.Math.Content.6.Sp.B.5a
Mr. Smith wants to know how tall all of his students are, in inches. He asked each of his students to write down their height. This data is displayed in the provided chart. Based on this histogram, how many observations were made?


For this plot, the number of observations made represents the number of students that participated in the survey. Each bar goes up to a certain number of students, so we can add up the height of each bar to determine the number of observations that were made.

If done correctly, we should have found that 

Certified Tutor

Certified Tutor

All Common Core: 6th Grade Math Resources

