Common Core: 5th Grade Math : Measurement & Data
Study concepts, example questions & explanations for Common Core: 5th Grade Math


All Common Core: 5th Grade Math Resources
Example Questions
Example Question #14 : How To Find The Answer From A Table
Mrs. Smith’s class made a line plot to show the amount of sugar that each student has in a given day.
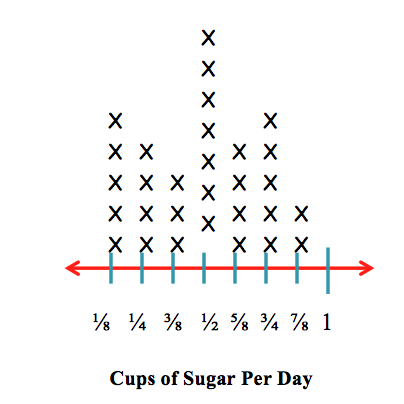
How many students have 


To solve this problem, we have to add the number of Xs above the 

There are 


Example Question #15 : How To Find The Answer From A Table
Mrs. Smith’s class made a line plot to show the amount of sugar that each student has in a given day.
How many students have 


To solve this problem, we have to add the number of Xs above the 

There are 


Example Question #1 : Make A Line Plot To Display A Data Set Of Measurements In Fractions And Solve Problems: Ccss.Math.Content.5.Md.B.2
Mrs. Smith’s class made a line plot to show the amount of sugar that each student consumes in a given day.
How many students consume 


Each X represents one person. There are 

Example Question #1542 : Common Core Math: Grade 5
Mrs. Smith’s class made a line plot to show the amount of sugar that each student has in a given day.
How many students have 


Each X represents one person. There are 

Example Question #2 : Make A Line Plot To Display A Data Set Of Measurements In Fractions And Solve Problems: Ccss.Math.Content.5.Md.B.2
Mrs. Smith’s class made a line plot to show the amount of sugar that each student has in a given day.
How many students have 


To solve this problem, we have to add the number of Xs above the 

There are 


Example Question #1543 : Common Core Math: Grade 5
Mrs. Smith’s class made a line plot to show the amount of sugar that each student has in a given day.
How many students have 


Each X represents one person. There are 

Example Question #1541 : Common Core Math: Grade 5
Mrs. Smith’s class made a line plot to show the amount of sugar that each student has in a given day.
How many students have 


Each X represents one person. There are 

Example Question #12 : Make A Line Plot To Display A Data Set Of Measurements In Fractions And Solve Problems: Ccss.Math.Content.5.Md.B.2
The line chart shows how many books each student in Mrs. Smith's class read this week. How many students are in Mrs. Smith's class?


In order to determine how many students there are we need to count up all the x marks above each number in the line chart, as each x represents one student. We know that 6 students read one book, 5 read two books, 6 read three books, 5 read four books, 5 read five books, and 3 read six books. 5 + 6 + 5 + 6 + 5 + 3 = 30, so the correct answer is 30.
Example Question #1542 : Common Core Math: Grade 5
A box is 3 feet long, 4 feet wide, and 6 feet high. The volume of the box is ___________.


Certified Tutor

Certified Tutor

All Common Core: 5th Grade Math Resources

