Common Core: 5th Grade Math : Make a Line Plot to Display a Data Set of Measurements in Fractions and Solve Problems: CCSS.Math.Content.5.MD.B.2
Study concepts, example questions & explanations for Common Core: 5th Grade Math


All Common Core: 5th Grade Math Resources
Example Questions
Example Question #11 : How To Find The Answer From A Table
Mrs. Smith’s class made a line plot to show the amount of sugar that each student has in a given day.
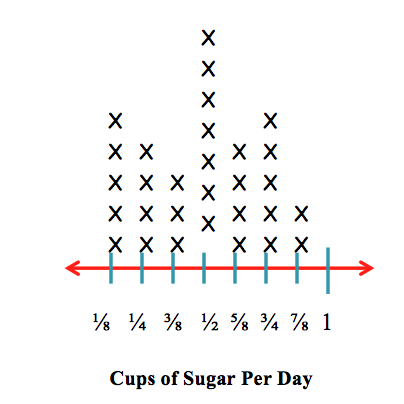
How many students have 


Each X represents one person. There are 

Example Question #11 : How To Find The Answer From A Table
Mrs. Smith’s class made a line plot to show the amount of sugar that each student has in a given day.
How many students have 


Each X represents one person. There are 

Example Question #12 : How To Find The Answer From A Table
Mrs. Smith’s class made a line plot to show the amount of sugar that each student has in a given day.
How many students have 


Each X represents one person. There are 

Example Question #14 : How To Find The Answer From A Table
Mrs. Smith’s class made a line plot to show the amount of sugar that each student has in a given day.
How many students have 


To solve this problem, we have to add the number of Xs above the 

There are 


Example Question #15 : How To Find The Answer From A Table
Mrs. Smith’s class made a line plot to show the amount of sugar that each student has in a given day.
How many students have 


To solve this problem, we have to add the number of Xs above the 

There are 


Example Question #1 : Make A Line Plot To Display A Data Set Of Measurements In Fractions And Solve Problems: Ccss.Math.Content.5.Md.B.2
Mrs. Smith’s class made a line plot to show the amount of sugar that each student consumes in a given day.
How many students consume 


Each X represents one person. There are 

Example Question #1542 : Common Core Math: Grade 5
Mrs. Smith’s class made a line plot to show the amount of sugar that each student has in a given day.
How many students have 


Each X represents one person. There are 

Example Question #2 : Make A Line Plot To Display A Data Set Of Measurements In Fractions And Solve Problems: Ccss.Math.Content.5.Md.B.2
Mrs. Smith’s class made a line plot to show the amount of sugar that each student has in a given day.
How many students have 


To solve this problem, we have to add the number of Xs above the 

There are 


Example Question #1543 : Common Core Math: Grade 5
Mrs. Smith’s class made a line plot to show the amount of sugar that each student has in a given day.
How many students have 


Each X represents one person. There are 


Certified Tutor

Certified Tutor

All Common Core: 5th Grade Math Resources

