Common Core: 5th Grade Math : Make a Line Plot to Display a Data Set of Measurements in Fractions and Solve Problems: CCSS.Math.Content.5.MD.B.2
Study concepts, example questions & explanations for Common Core: 5th Grade Math


All Common Core: 5th Grade Math Resources
Example Questions
Example Question #1541 : Common Core Math: Grade 5
Mrs. Smith’s class made a line plot to show the amount of sugar that each student has in a given day.
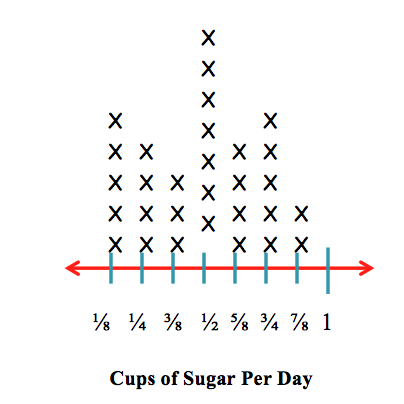
How many students have 
Possible Answers:


Correct answer:
Explanation:
Each X represents one person. There are 

Example Question #12 : Make A Line Plot To Display A Data Set Of Measurements In Fractions And Solve Problems: Ccss.Math.Content.5.Md.B.2
The line chart shows how many books each student in Mrs. Smith's class read this week. How many students are in Mrs. Smith's class?

Possible Answers:


Correct answer:
Explanation:
In order to determine how many students there are we need to count up all the x marks above each number in the line chart, as each x represents one student. We know that 6 students read one book, 5 read two books, 6 read three books, 5 read four books, 5 read five books, and 3 read six books. 5 + 6 + 5 + 6 + 5 + 3 = 30, so the correct answer is 30.

Kenneth
Certified Tutor
Certified Tutor
North Georgia University, Bachelors, Accounting. Brenau University, Masters, Business.

Marlene
Certified Tutor
Certified Tutor
Herbert Lehman, Bachelors, Recreation Education. Long Island University-Brooklyn Campus, Masters, Special Education.

All Common Core: 5th Grade Math Resources
Popular Subjects
Spanish Tutors in Los Angeles, Physics Tutors in San Francisco-Bay Area, French Tutors in New York City, Math Tutors in Philadelphia, Spanish Tutors in San Diego, Biology Tutors in Atlanta, SSAT Tutors in Seattle, Computer Science Tutors in Los Angeles, GRE Tutors in Washington DC, Chemistry Tutors in Dallas Fort Worth
Popular Courses & Classes
GMAT Courses & Classes in Washington DC, ISEE Courses & Classes in Chicago, SAT Courses & Classes in San Francisco-Bay Area, Spanish Courses & Classes in Miami, LSAT Courses & Classes in Boston, LSAT Courses & Classes in Atlanta, Spanish Courses & Classes in Los Angeles, SAT Courses & Classes in Miami, Spanish Courses & Classes in San Francisco-Bay Area, ACT Courses & Classes in San Diego
Popular Test Prep
MCAT Test Prep in Philadelphia, GMAT Test Prep in Houston, SSAT Test Prep in San Diego, GMAT Test Prep in Miami, SSAT Test Prep in Philadelphia, SSAT Test Prep in Boston, GMAT Test Prep in San Diego, GMAT Test Prep in Washington DC, ISEE Test Prep in Boston, GRE Test Prep in San Francisco-Bay Area

