Algebra II : Graphing Linear Functions
Study concepts, example questions & explanations for Algebra II


All Algebra II Resources
Example Questions
Example Question #1 : Graphing Linear Functions
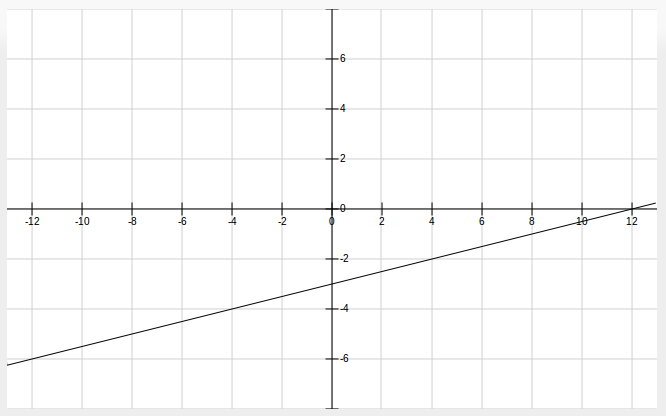
Which equation best matches the graph of the line shown above?
")
")
")
")
To find an equation of a line, we will always need to know the slope of that line -- and to find the slope, we need at least two points. It looks like we have (0, -3) and (12,0), which we'll call point 1 and point 2, respectively.
}{12-0}=\frac{3}{12}=\frac{1}{4}")
Now we need to plug in a point on the line into an equation for a line. We can use either slope-intercept form or point-slope form, but since the answer choices are in point-slope form, let's use that.
")
")
Unfortunately, that's not one of the answer choices. That's because we didn't pick the same point to substitute into our equation as the answer choices did. But we can see if any of the answer choices are equivalent to what we found. Our equation is equal to:

which is the slope-intercept form of the line. We have to put all the other answer choices into slope-intercept to see if they match. The only one that works is this one:
")
-2")


Example Question #4 : How To Find A Solution Set
Determine where the graphs of the following equations will intersect.


")
")
")
")
We can solve the system of equations using the substitution method.


Solve for 


Substitute this value of 
+2y=-1")
Now we can solve for 


Solve for 

=-1")


The solution is the ordered pair ")
Example Question #2 : Graphing Linear Functions

Refer to the line in the above diagram. It we were to continue to draw it so that it intersects the 

")
")
")
")
")
First, we need to find the slope of the line.
In order to move from the lower left point to the upper right point, it is necessary to move up five units and right three units. This is a rise of 5 and a run of 3. makes the slope of the line shown 
We can use this to find the 
")
The lower left point has coordinates ")


= \frac{5}{3}\cdot (-2)")


Example Question #1 : Graphing Functions
Line 
")
")

")
")
The lines are identical.
The lines are distinct but neither parallel nor perpendicular.
The lines are parallel.
Insufficient information is given to answer this question.
The lines are perpendicular.
The lines are parallel.
We calculate the slopes of the lines using the slope formula.
The slope of line 
} = \frac{0}{10} =0")
The slope of line 
}{8 - 5} = \frac{0}{3} =0")
The lines have the same slope, making them either parallel or identical.
Since the slope of each line is 0, both lines are horizontal, and the equation of each takes the form 


Example Question #1 : Graphing Linear Functions

What is the equation of the above line?


The equation of a line is 
")

")


Example Question #1 : Graphing Linear Functions

What is the equation of the line displayed above?


The equation of a line is 
")

The x-intercept is at ")


Example Question #3 : Graphing Inequalities

Refer to the above diagram. which of the following compound inequality statements has this set of points as its graph?


A horizontal line has equation 


A vertical line has equation 


Since only the region belonging to both sets is shaded - that is, their intersection is shaded - the statements are connected with "and". The correct choice is 
Example Question #2 : Graphing Linear Functions

Which of the following inequalities is graphed above?


First, we determine the equation of the boundary line. This line includes points ")
")

Since we also know the 
")


The boundary is included, as is indicated by the line being solid, so the equality symbol is replaced by either 

")


0 is less than 3 so the correct symbol is 
The inequality is 
Example Question #64 : Linear Inequalities

Which of the following inequalities is graphed above?


First, we determine the equation of the boundary line. This line includes points ")
")

Since we also know the 
")


The boundary is excluded, as is indicated by the line being dashed, so the equality symbol is replaced by either 

")


1 is greater than 0 so the correct symbol is

The inequality is

Example Question #3 : Graphing Linear Functions
Which of the following is the function graphed below?


This function is linear (a line), so we must remember that we can represent lines algebraically using y=mx+b, where m is the slope and b is the y-intercept.
Looking at the graph, we can tell immediately that the y-intercept is -5, because the line crosses(intercepts) the y-axis at -5.
To find the slope, we need two points, ,(x_{2},y_{2})")

For the sake of the example, choose (0,-5) and (2,-1). We can see that the graph clearly passes through each of these points. Any two points will do, however. Substituting each of the values into the slope formula yields m=2.
Thus, our final answer is


All Algebra II Resources

