Algebra II : Graphing Linear Functions
Study concepts, example questions & explanations for Algebra II


All Algebra II Resources
Example Questions
Example Question #331 : Functions And Graphs
What is the slope of 


To solve this, first put the linear equation into slope-intercept form:

Recall that in slope intercept form

the m term is the slope value.
Therefore, the slope is 2.
Example Question #22 : Graphing Linear Functions
How many 
 = - x^{2} + 7x +11")
have?
Zero
Cannot be determined
One
Two
Four
Two
The graph of a quadratic function  = ax^{2}+ bx + c")

")
 = 0")

The number of 

(11)= 49 - (-44 ) = 93")
The discriminant is positive, so there are two real solutions to the quadratic equation, and the graph of the function has two
Example Question #121 : Functions And Graphs
Which of the following graphs correctly depicts the graph of the inequality 

None of the graphs.


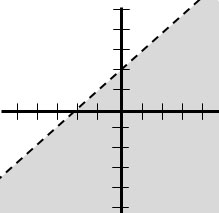
Let's start by looking at the given equation:

The inequality is written in slope-intercept form; therefore, the slope is equal to 

All of the graphs depict a line with slope of 

")


Because this statement is true, the origin must be included in the shaded region, so we shade below the line.
Finally, a statement that is "less than" or "greater than" requires a dashed line in the graph. On the other hand, those that are "greater than or equal to" or "less than or equal to" require a solid line. We will select the graph with shading below a dashed line.

Certified Tutor

Certified Tutor

All Algebra II Resources

