Algebra 1 : How to graph a line
Study concepts, example questions & explanations for Algebra 1


All Algebra 1 Resources
Example Questions
Example Question #1 : How To Graph A Line
Which of the following is the graph of the equation 


On the coordinate plane, the graph of an equation of the form 

")


")
Example Question #21 : Functions And Lines
Which of the following is the graph of the equation 
On the coordinate plane, the graph of an equation of the form 

")


")
Example Question #22 : Functions And Lines
Which of the following is the graph of the equation 
None of the other choices are correct.
None of the other choices are correct.
Since the intercepts are shown on each graph, we find the intercepts of 

Set


The graph goes through ")
Example Question #23 : Functions And Lines
Which of the following graphs best represents the following function?
=2x-2")
None of these
=2x-2")
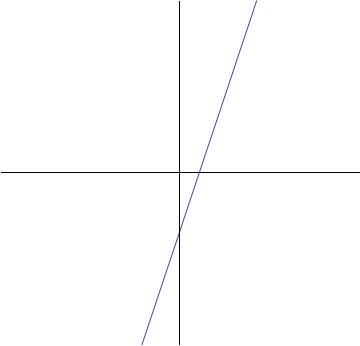
This equation describes a straight line with a slope of 
")
=mx-b")
The graph below is the answer, as it depicts a straight line with a positive slope and a negative y-intercept.
Example Question #24 : Functions And Lines
Which of the following choices is an accurate visual description of the graph of

A line with a positive slope that crosses the 
")
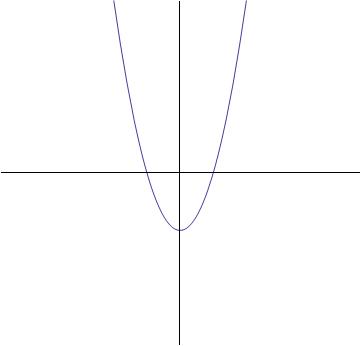
A parabola with its vertex at
")
A line with a slope of 

A line with a slope of zero that crosses the 
")
A line with a negative slope that crosses the 
")
A line with a negative slope that crosses the
Though this is a question about a graph, we don't actually have to graph this equation to get a visual idea of its behavior. We just need to put it into slope-intercept form. First, we subtract 

Simplified, this equation becomes

Remember, this is in 


")
Example Question #25 : Functions And Lines
Which of the following is the graph of the equation 
None of the other choices are correct.
Since the intercepts are shown on each graph, we need to find the intercepts of 
To find the 


Therefore the 
")
To find the 


Thus the 
")
The correct choice is the line that passes through these two points.
Example Question #7 : How To Graph A Line
Which equation matches the graph of the line shown?


An equation of a line is made of two parts: a slope and a y-intercept.
The y-intercept is where the function crosses the y-axis which in this problem it is 0.
The slope is determined by the rise of the function over the run which is 
Therefore your equation is:


All Algebra 1 Resources

