ACT Science : How to find synthesis of data in chemistry
Study concepts, example questions & explanations for ACT Science


All ACT Science Resources
Example Questions
Example Question #141 : Chemistry
A student performed the following procedures to study various photosynthetic pigments (light-absorbing chemicals) in tree leaves and the wavelengths of light they absorb.
Experiment 1:
The student obtained samples of leaves from oaks, maples, ashes, sycamores, and poplars. Each leaf sample was ground separately with a mortar and pestle to release the pigments, and then each sample was suspended in water to make a colored solution of the pigment. The student then measured the absorption spectrum (a graph of how much light is absorbed by a pigment at varying wavelengths of light) of each solution in a device called a spectrophotometer. The setup of a spectrophotometer is shown below in Diagram 1.
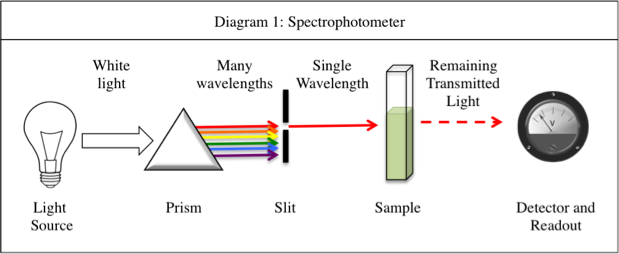
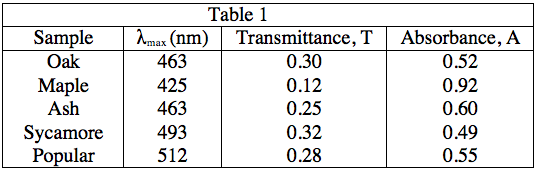
The light source emits white light, which is split into its various wavelengths by the prism. Next, a slit, which can be moved up or down to select a particular wavelength, is used to transmit just a single wavelength to the sample. The sample absorbs a fraction of this light that is characteristic to the pigment in the sample, and the rest is transmitted to the detector for a readout. Using the spectrophotometer, the student found the λmax (the wavelength of light in nanometers (nm) that the pigment absorbs most intensely, for each sample) and recorded the results in Table 1. Table 1 also shows the transmittance and absorbance values at λmax. Transmittance, T, is defined as the fraction of light, expressed as a decimal, which passes through the sample. Absorbance, A, is given by:
A = –log(T) or 10–A = T
Experiment 2:
A student is given a leaf from an unknown source. She crushes and extracts the pigment according to the procedure in Experiment 1. Measuring the absorbance spectrum in the spectrophotometer produces the following readout, shown in Diagram 2.
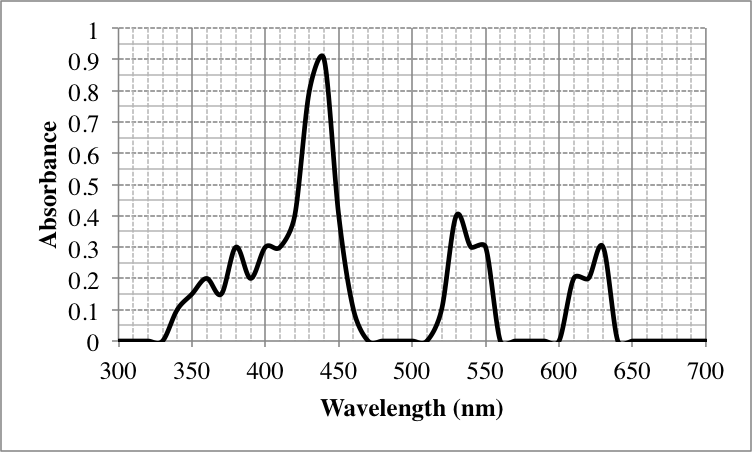
Diagram 2
In Experiment 2, at which of the following wavelengths, in nanometers, is the most amount of light transmitted through the sample?
450
350
500
400
500
As the equations in the description of Experiment 1, as well as the patterns in the data in Table 1 indicate, a low absorbance provides a high transmittance and vice-versa. Thus, to find what wavelength gives the highest value of transmittance, we must look for the lowest absorbance value. As 500 nm gives an absorbance of 0, it will give a transmittance of 100%, the highest possible value.
A = 0, 10–0 = T = 1, or 100%
Example Question #51 : How To Find Synthesis Of Data In Chemistry
A student performed the following procedures to study various photosynthetic pigments (light-absorbing chemicals) in tree leaves and the wavelengths of light they absorb.
Experiment 1:
The student obtained samples of leaves from oaks, maples, ashes, sycamores, and poplars. Each leaf sample was ground separately with a mortar and pestle to release the pigments, and then each sample was suspended in water to make a colored solution of the pigment. The student then measured the absorption spectrum (a graph of how much light is absorbed by a pigment at varying wavelengths of light) of each solution in a device called a spectrophotometer. The setup of a spectrophotometer is shown below in Diagram 1.
The light source emits white light, which is split into its various wavelengths by the prism. Next, a slit, which can be moved up or down to select a particular wavelength, is used to transmit just a single wavelength to the sample. The sample absorbs a fraction of this light that is characteristic to the pigment in the sample, and the rest is transmitted to the detector for a readout. Using the spectrophotometer, the student found the λmax (the wavelength of light in nanometers (nm) that the pigment absorbs most intensely, for each sample) and recorded the results in Table 1. Table 1 also shows the transmittance and absorbance values at λmax. Transmittance, T, is defined as the fraction of light, expressed as a decimal, which passes through the sample. Absorbance, A, is given by:
A = –log(T) or 10–A = T
Experiment 2:
A student is given a leaf from an unknown source. She crushes and extracts the pigment according to the procedure in Experiment 1. Measuring the absorbance spectrum in the spectrophotometer produces the following readout, shown in Diagram 2.
Diagram 2
A standardized sample of a pigment often found in plant leaves, called Chlorophyll A, was placed into the spectrophotometer and found to have a λmaxof 425 nm. The leaves of which tree most likely have a high concentration of Chlorophyll A?
Oak
Maple
Sycamore
Popular
Maple
Table 1 shows that maple leaves have a λmaxat 425 nm. Thus, we can assume that this is most likely caused by the presence of Chlorophyll A as it has the same λmax, and the value of λmax is characteristic of a particular pigment.
Example Question #831 : Act Science
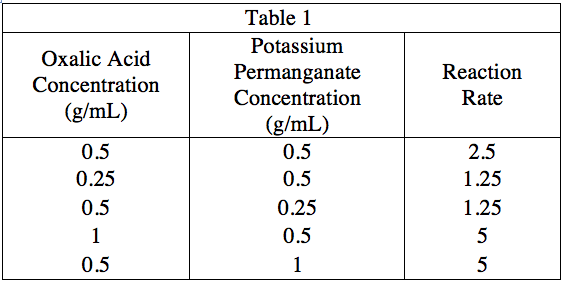
A student wanted to study the kinetics, or rates of a chemical reaction based on the concentrations of its reactants and products, of the reaction shown below.
}+2KMnO_4_{(aq)}+3H_2SO_4_{(aq)}\rightarrow")
}+2MnSO_4_{(aq)}+K_2SO_4_{(aq)}+8H_2O_{(l)}")
This reaction is easy to monitor using a spectrophotometer, which measures how much light of a particular wavelength is absorbed by a solution. The deep purple potassium permanganate, or 

Experiment 1:
The student constructed a standard curve, or a graph of the absorbance of solutions of varying concentrations of potassium permanganate, to quantify the relationship between concentration and absorbance. To prepare five sample of increasing concentration, he labeled five test tubes A, B, C, D, and E, weighed out 0.1, 0.2, 0.3, 0.4, and 0.5 grams of potassium permanganate into each, respectively, and added 1 milliliter (mL) of water to each test tube to dissolve. Then, he used the spectrophotometer to determine the absorbance at 550 nm of each sample. The data is graphed in Figure 1 below.
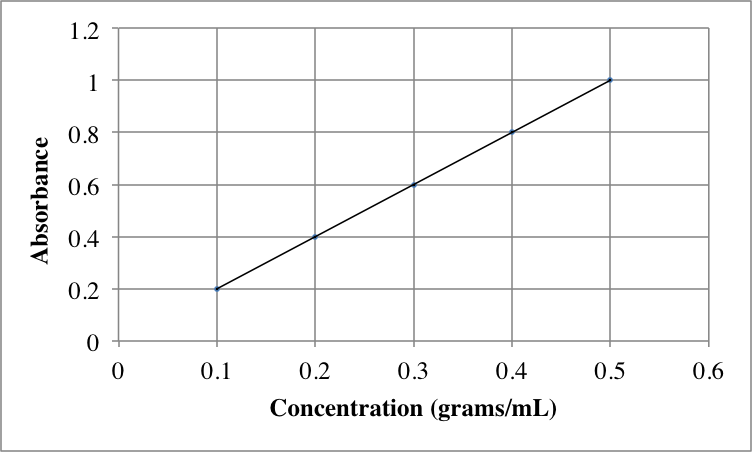
Figure 1
Experiment 2:
The student then studied potassium permanganate in the presence of oxalic acid, 
The rate constant, 
\cdot (Concentration \:of \:reactant \:2)")
What is the rate constant for the reaction studied in Experiment 2?


We can obtain the value of the rate constant by plugging in values to this equation. Using the top row of data of Table 1, we can see that a rate of 2.5 occurs when concentrations of both potassium permanganate and oxalic acid are 0.5 grams/ml. Plugging this into our equation, we see that

or,

By dividing, we see that 
Example Question #54 : How To Find Synthesis Of Data In Chemistry
A student wanted to study the kinetics, or rates of a chemical reaction based on the concentrations of its reactants and products, of the reaction shown below.
This reaction is easy to monitor using a spectrophotometer, which measures how much light of a particular wavelength is absorbed by a solution. The deep purple potassium permanganate, or
Experiment 1:
The student constructed a standard curve, or a graph of the absorbance of solutions of varying concentrations of potassium permanganate, to quantify the relationship between concentration and absorbance. To prepare five sample of increasing concentration, he labeled five test tubes A, B, C, D, and E, weighed out 0.1, 0.2, 0.3, 0.4, and 0.5 grams of potassium permanganate into each, respectively, and added 1 milliliter (mL) of water to each test tube to dissolve. Then, he used the spectrophotometer to determine the absorbance at 550 nm of each sample. The data is graphed in Figure 1 below.
Figure 1
Experiment 2:
The student then studied potassium permanganate in the presence of oxalic acid, 
Reaction rate is given by the following equation:
Imagine that 


As we saw in Question 3, the rate is given by:
We are told in the question stem to assume that k=24 for this particular reaction. If we plug in 2 for both reactant concentrations, we get:
(2)")


Example Question #51 : How To Find Synthesis Of Data In Chemistry
The Ideal Gas Law is as follows:


A class of students began studying the Ideal Gas Law and how the Pressure and the Volume relate to one another. They took 20 moles of a sample gas and kept the room at a temperature of 300 Kelvin. They then used different sized containers of the gas to limit and expand the volume. At each different volume, they measure the pressure of the gas on its container. The table they made from their results is seen in table 1.
|
Volume of the container |
Pressure Measured in Pascals |
|
1 cubic meter |
49,884 Pascals |
|
2 cubic meters |
24,942 Pascals |
|
3 cubic meters |
16,628 Pascals |
|
4 cubic meters |
12,471 Pascals |
|
5 cubic meters |
9,976.8 Pascals |
|
6 cubic meters |
8,314 Pascals |
|
7 cubic meters |
7,126.2 Pascals |
TABLE 1
And they graph their findings in Figure 1.
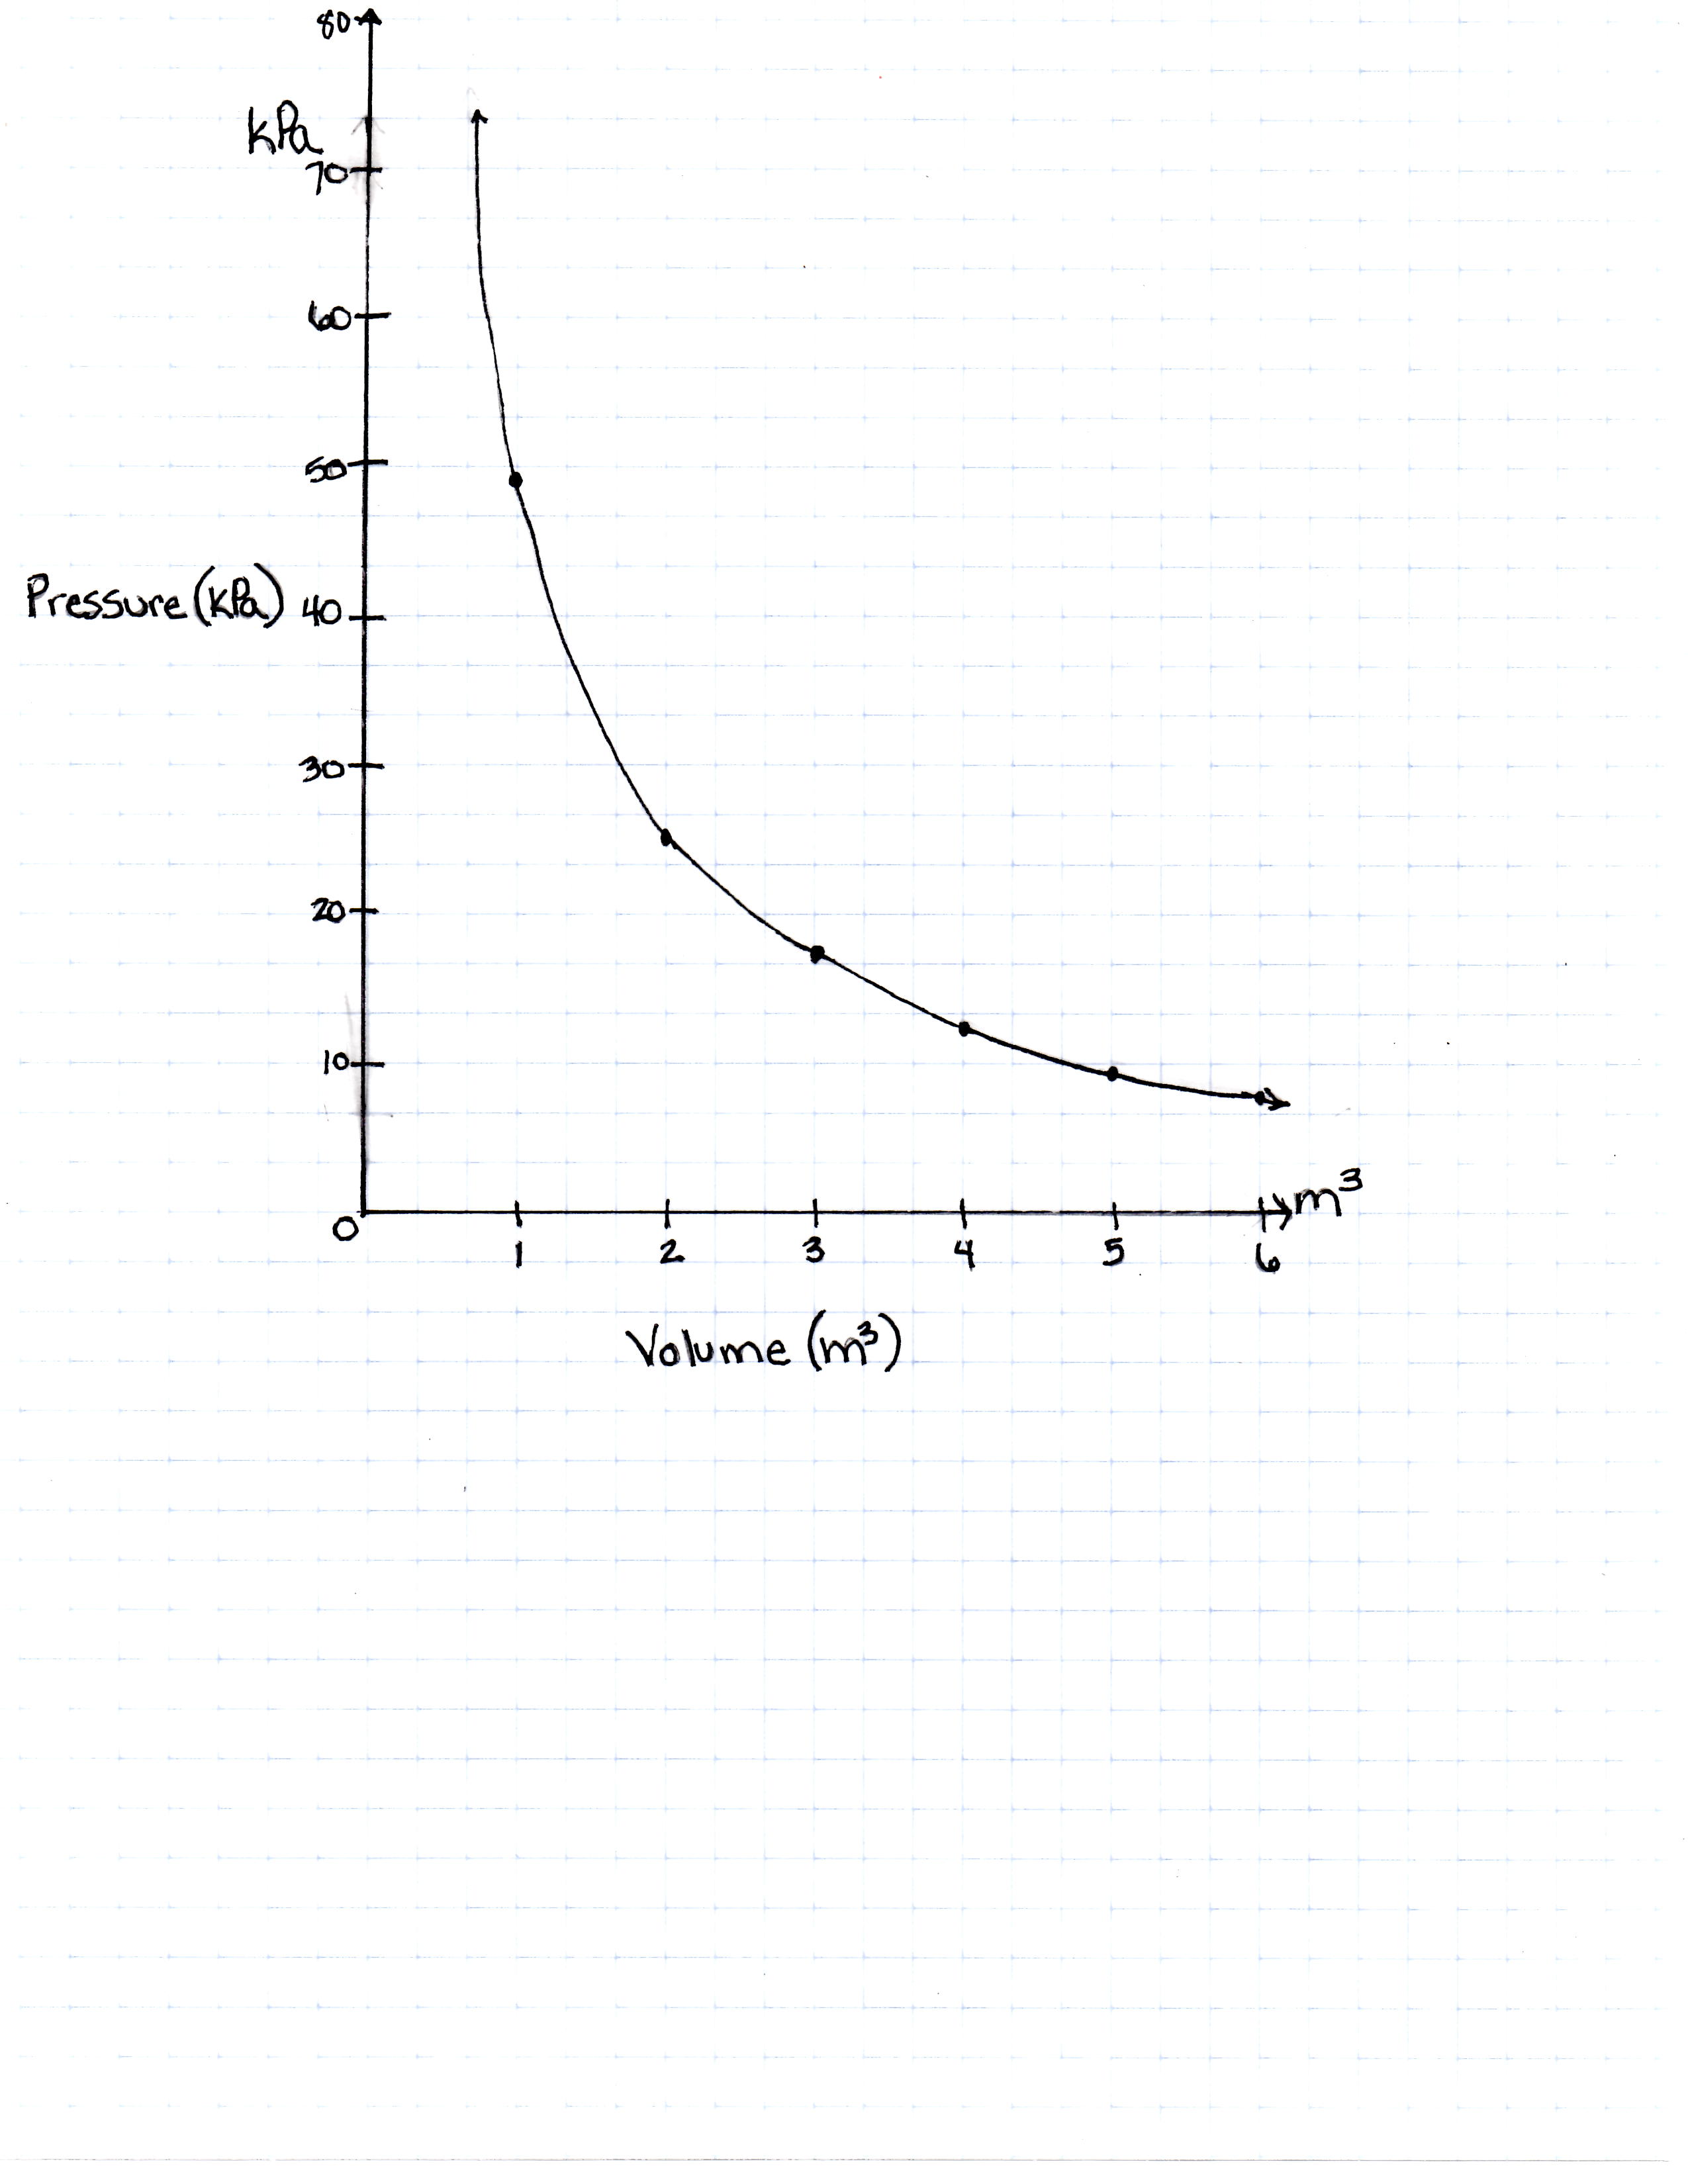
FIGURE 1
If the Kelvin temperature were to rise, what would happen to the pressure?
Pressure decreases
Pressure increases but only until Kelvin reaches 500, and then it decreases
Pressure remains constant
The temperature has no predictable effect on the pressure because there are too many other variables
Pressure increases
Pressure increases
As the temperature increases, the pressure a gas puts on its container increases. Warmer temperature means more molecule movement, which makes the pressure higher.
Example Question #52 : How To Find Synthesis Of Data In Chemistry
The Ideal Gas Law is as follows:


A class of students began studying the Ideal Gas Law and how the Pressure and the Volume relate to one another. They took 20 moles of a sample gas and kept the room at a temperature of 300 Kelvin. They then used different sized containers of the gas to limit and expand the volume. At each different volume, they measure the pressure of the gas on its container. The table they made from their results is seen in table 1.
|
Volume of the container |
Pressure Measured in Pascals |
|
1 cubic meter |
49,884 Pascals |
|
2 cubic meters |
24,942 Pascals |
|
3 cubic meters |
16,628 Pascals |
|
4 cubic meters |
12,471 Pascals |
|
5 cubic meters |
9,976.8 Pascals |
|
6 cubic meters |
8,314 Pascals |
|
7 cubic meters |
7,126.2 Pascals |
TABLE 1
And they graph their findings in Figure 1.
FIGURE 1
Would Figure 1 be the same for 1 mole of hydrogen gas as it would be for 1 mole of oxygen gas?
No, hydrogen is a heavier gas than oxygen.
No, the Ideal Gas Law works for neither because they are both solids at room temperature.
No, oxygen is a heavier gas than hydrogen.
Yes. There is no place in the equation to include the type of gas, only the number of moles available. The equation is for any gas.
Yes, but it only works for hydrogen and oxygen, as they are the most common gases.
Yes. There is no place in the equation to include the type of gas, only the number of moles available. The equation is for any gas.
Moles is a measure of the amount of any type of gas; the Ideal Gas Law does not need or have a place for a variable type of gas. The number of moles of any type of gas fits into the equation.
Example Question #53 : How To Find Synthesis Of Data In Chemistry
The Ideal Gas Law is as follows:


A class of students began studying the Ideal Gas Law and how the Pressure and the Volume relate to one another. They took 20 moles of a sample gas and kept the room at a temperature of 300 Kelvin. They then used different sized containers of the gas to limit and expand the volume. At each different volume, they measure the pressure of the gas on its container. The table they made from their results is seen in table 1.
|
Volume of the container |
Pressure Measured in Pascals |
|
1 cubic meter |
49,884 Pascals |
|
2 cubic meters |
24,942 Pascals |
|
3 cubic meters |
16,628 Pascals |
|
4 cubic meters |
12,471 Pascals |
|
5 cubic meters |
9,976.8 Pascals |
|
6 cubic meters |
8,314 Pascals |
|
7 cubic meters |
7,126.2 Pascals |
TABLE 1
And they graph their findings in Figure 1.
FIGURE 1
What would the pressure be if the volume was 100 cubic meters?


One can plug 100 cubic meters into the equation, but the equation is measured in pascals. To find it in the SI unit kilopascals, one must divide by 1000.
Example Question #54 : How To Find Synthesis Of Data In Chemistry
The Ideal Gas Law is as follows:


A class of students began studying the Ideal Gas Law and how the Pressure and the Volume relate to one another. They took 20 moles of a sample gas and kept the room at a temperature of 300 Kelvin. They then used different sized containers of the gas to limit and expand the volume. At each different volume, they measure the pressure of the gas on its container. The table they made from their results is seen in table 1.
|
Volume of the container |
Pressure Measured in Pascals |
|
1 cubic meter |
49,884 Pascals |
|
2 cubic meters |
24,942 Pascals |
|
3 cubic meters |
16,628 Pascals |
|
4 cubic meters |
12,471 Pascals |
|
5 cubic meters |
9,976.8 Pascals |
|
6 cubic meters |
8,314 Pascals |
|
7 cubic meters |
7,126.2 Pascals |
TABLE 1
And they graph their findings in Figure 1.
FIGURE 1
If the same 20 moles of the same gas were taken to sea level (at a pressure of 100,000 Pascals) and heated to 300 Kelvin, how large would the volume of the container be to hold it at its new pressure?


Not enough information

Pressure increases as volume decreases. For the gas to be put at the air pressure at sea level, which is approximtely ")


All ACT Science Resources

