ACT Science : How to find synthesis of data in chemistry
Study concepts, example questions & explanations for ACT Science


All ACT Science Resources
Example Questions
Example Question #31 : How To Find Synthesis Of Data In Chemistry
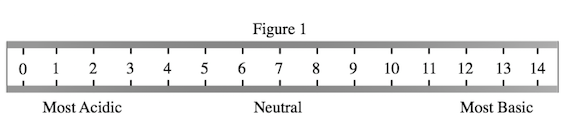
A student wished to study the acidity and basicity of various household ingredients and chemicals using her own, homemade pH indicator. A pH indicator is a substance that changes colors to indicate the acidity or basicity of a chemical solution. Acids can be defined as substances that donate hydrogen ions, or H+, while bases are substances that accept H+ ions. The strength of these acids and bases can be measured using the pH scale as shown in Figure 1.
Experiment 1:
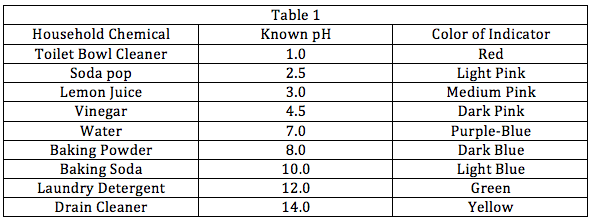
The student placed a leaf of red cabbage in a blender with one liter of water and blended until the cabbage had been liquefied. She then strained the purple mixture and bottled it. The student then added one drop of her homemade cabbage pH indicator to a variety of household chemicals listed in Table 1. She recorded the known pH of these chemicals as well as the color the indicator turned when added to these chemicals.
Experiment 2:
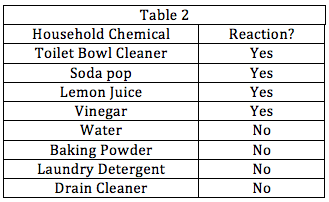
The student wanted to see how baking soda would react in the presence of other household chemicals. She combined baking soda in water separately with each of the other chemicals used in Experiment 1. Some combinations would create bubbling while some other combinations wouldn't. She recorded the results in Table 2 below.
What can be inferred from Experiment 2?
None of the other answers is correct.
Baking soda only produces bubbles in the presence of an acid.
Baking soda only produces bubbles in the presence of a chemical with a neutral pH.
Baking soda only produces bubbles in the presence of a base.
Baking soda only produces bubbles in the presence of an acid.
Baking soda reacts, or produces bubbles, with lemon juice, vinegar, toilet bowl cleaner, and soda pop only. By cross-referencing Table 1, we see that these substances have a pH of less than 7, which is the definition of an acid as Figure 1 shows. Thus, we know that baking soda only reacts with acids.
Example Question #32 : How To Find Synthesis Of Data In Chemistry
A student wished to study the acidity and basicity of various household ingredients and chemicals using her own, homemade pH indicator. A pH indicator is a substance that changes colors to indicate the acidity or basicity of a chemical solution. Acids can be defined as substances that donate hydrogen ions, or H+, while bases are substances that accept H+ ions. The strength of these acids and bases can be measured using the pH scale as shown in Figure 1.
Experiment 1:
The student placed a leaf of red cabbage in a blender with one liter of water and blended until the cabbage had been liquefied. She then strained the purple mixture and bottled it. The student then added one drop of her homemade cabbage pH indicator to a variety of household chemicals listed in Table 1. She recorded the known pH of these chemicals as well as the color the indicator turned when added to these chemicals.
Experiment 2:
The student wanted to see how baking soda would react in the presence of other household chemicals. She combined baking soda in water separately with each of the other chemicals used in Experiment 1. Some combinations would create bubbling while some other combinations wouldn't. She recorded the results in Table 2 below.
A new indicator, called Methyl Red, is also used to test the household chemicals from Experiments 1 and 2. It is found that the indicator turns red in the presence of toilet bowl cleaner, soda pop, or lemon juice; it turns orange in the presence of vinegar; it turns yellow in the presence of the rest of the chemicals. Which of the following pH ranges most likely contain the pH value at which Methyl Red has its color transition, or pH at which the indicator will stop being red and change to yellow?


It appears that the color transition happens at the pH range around the pH of vinegar, given that the indicator in vinegar is orange, and orange is produced by a combination of red and yellow. As the pH of vinegar, according to Table 1, is 4.5, the range of 4 to 6 is the correct answer as it contains the value.
Example Question #33 : How To Find Synthesis Of Data In Chemistry
A student wished to study the acidity and basicity of various household ingredients and chemicals using her own, homemade pH indicator. A pH indicator is a substance that changes colors to indicate the acidity or basicity of a chemical solution. Acids can be defined as substances that donate hydrogen ions, or H+, while bases are substances that accept H+ ions. The strength of these acids and bases can be measured using the pH scale as shown in Figure 1.
Experiment 1:
The student placed a leaf of red cabbage in a blender with one liter of water and blended until the cabbage had been liquefied. She then strained the purple mixture and bottled it. The student then added one drop of her homemade cabbage pH indicator to a variety of household chemicals listed in Table 1. She recorded the known pH of these chemicals as well as the color the indicator turned when added to these chemicals.
Experiment 2:
The student wanted to see how baking soda would react in the presence of other household chemicals. She combined baking soda in water separately with each of the other chemicals used in Experiment 1. Some combinations would create bubbling while some other combinations wouldn't. She recorded the results in Table 2 below.
A universal indicator is a pH indicator that is a mix of several different indicators that have distinct color changes in various ranges of the pH scale in order to precisely tell the pH of any solution. While the red cabbage indictor is a good indicator for most pHs, it has one range that does not have drastic enough color changes to precisely tell the pH within this region. What pH range should a supplemental indicator have drastic colors changes in to improve the red cabbage indictor?


Table 1 shows that the indicator does not change much from the pH of vinegar, or 4.5, to the pH of soda pop, 2.5, since it is some shade of pink at all pH values in this range. Thus, the red cabbage indicator could be improved by adding an indicator that changes color drastically in this region. The answer choice that lists the range from 2 to 4 is the closest answer choice.
Example Question #133 : Chemistry
When describing their behavior, gases are typically treated as "ideal gases" in what is known as the ideal gas law. Two science students describe the ideal gas law in their own terms:
Student 1: The ideal gas law is based on the assumptions that a gas consists of a large number of molecules and that gas molecules take up negligible space in a gas due to their minuscule size in comparison to the space between each gas molecule. Also important is the assumption that all of the forces acting on gas molecules are from collisions with other gas molecules or a container and not from anything else. According to the ideal gas law, all gases behave the same so long as those assumptions hold true. Therefore, if you measure the volume of helium gas at a certain temperature and pressure, an equivalent amount of radon gas (a much heavier gas) at the same conditions will have the same volume.
Student 2: The ideal gas law's primary assumption is that a gas consists of a very large number of particles. For example, even within a single bacteria there can be billions of gas molecules despite the bacteria's very small size. Therefore, in a room full of gas, there are so many particles that their random behavior is, on average, uniform. There are exceptions to the ideal gas law and those are gases with very high inter-molecular forces of attraction (IMFAs). A gas with high IMFA will behave very differently than a gas with a low IMFA. As one could imagine, because a gas with a high IMFA will have molecules that tend to attract each other, that gas will display a lower volume than that which would be predicted by the ideal gas law.
"Dipole moment" is a measure of the IMFAs of a molecule. A higher dipole moment indicates stronger interactions. Based on Student 2's description of the ideal gas law, which of the following molecules would display the greatest deviation from ideal behavior when in gaseous form?
Phenol (Dipole moment = 8.6)
Toluene (Dipole moment = 0.9)
Chlorobenzene (Dipole moment = 8.6 debye)
Ethanol (Dipole moment = 9.7 debye)
Ethyl ether (Dipole moment = 7.1 debye)
Ethanol (Dipole moment = 9.7 debye)
The correct answer to this question is the molecule with the highest dipole moment. A higher dipole moment means higher IMFA, which according to Student 2 would cause the greatest deviation from ideal gas behavior.
Example Question #34 : How To Find Synthesis Of Data In Chemistry
Gases can be described by their average molecular speeds. Gases are made up of huge numbers of molecules which vary greatly in speed. The average speeds of those molecules is related to the mass of the gas particles. For example, a heavy gas will have a much lower average molecular speed than a lighter gas.
The rate of effusion of a gas is defined as the rate at which a gas in a chamber can escape through a pinhole. A gas molecule with a higher average molecular speed is more likely to exit a pinhole and therefore has a higher rate of effusion.
The rate of diffusion of a gas is the rate at which a quantity of gas can spread uniformally throughout a room. Its relationship with the average speed of gas molecules is parallel to that of the rate of effusion. Based on this information and the information provided in the passage, which of the following gases would have the lowest rate of diffusion?
Hydrogen gas (molecular weight = 2 amu)
Chlorine gas (molecular weight = 71 amu)
Carbon Dioxide (molecular weight = 44 amu)
Oxygen gas (molecular weight = 32 amu)
Radon (molecular weight = 222 amu)
Radon (molecular weight = 222 amu)
The correct answer is radon gas. Radon has the largest molecular weight of all the gases presented and therefore would have the lowest average molecular speed. This would indicate also the lowest rate of both effusion and diffusion.
Example Question #35 : How To Find Synthesis Of Data In Chemistry
The electrons of an atom surround the nucleus and reside in atomic orbitals. In transition metals such as iron (


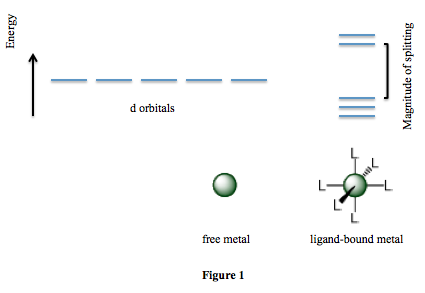
Scientists perform a number of experiments to determine how various factors affect the magnitude of splitting. They find that the charge on the metal, the metal's position on the periodic table (whether it resides in Period 4, 5, or 6), and the identity of the ligand are all important factors. The scientists' results are summarized in Table 1. Note that a higher value of 
Table 1
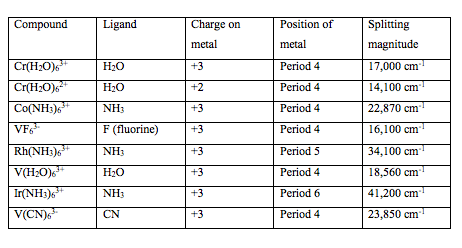
Which of the following statements is supported by the data presented in Table 1?


If we compare _6}^{3+}")
_6}^{3-}")


Example Question #36 : How To Find Synthesis Of Data In Chemistry
The electrons of an atom surround the nucleus and reside in atomic orbitals. In transition metals such as iron (
Scientists perform a number of experiments to determine how various factors affect the magnitude of splitting. They find that the charge on the metal, the metal's position on the periodic table (whether it resides in Period 4, 5, or 6), and the identity of the ligand are all important factors. The scientists' results are summarized in Table 1. Note that a higher value of
Table 1
An unknown compound is tested and its splitting magnitude is found to be 
Period 5
Period 4
None of the other answer choices is correct.
Period 6
Period 5
Since the splitting magnitude is closest to that of _6}^{3+}")

Example Question #37 : How To Find Synthesis Of Data In Chemistry
Nanoparticles are fabricated by vigorously mixing the constituent components of the particle in solution. A scientist has four different compositions that she has tested: Composition A, Composition B, Composition C, and Composition D. All of these compositions were observed under similar laboratory conditions using different mixing times. The average particle size for each scenario was recorded in the provided table.
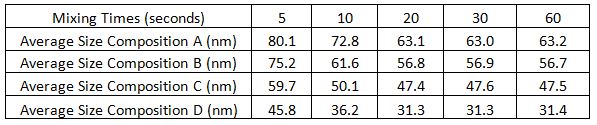
What can be deduced about the affect of mixing time on nanoparticle size?
Increasing the mixing time created nanoparticles with a smaller radius
Increasing the mixing time created nanoparticles with a larger radius
Longer mixing times up to 

Longer mixing times up to 

It cannot be determined from the given information
Longer mixing times up to
Look at a specific composition. For example, observe Composition A. At mixing times of 


Example Question #38 : How To Find Synthesis Of Data In Chemistry
A free energy reaction diagram shows the energy of a chemical reaction as it progresses from start to finish. In Example 1 below, the reactants (at point A) start with a certain energy. Energy is then applied to initiate the reaction (this is called activation energy) and the reaction progresses to point B. Lastly, energy is released in the reaction leading to point C. If the net change in free energy of a reaction is positive, the reaction is called a nonspontaneous reaction, meaning that it takes more energy to initiate it than the energy released. If the net change in free energy of a reaction is negative, it is called spontaneous, meaning that the energy released is more than the energy needed to initiate the reaction.
Example 1:
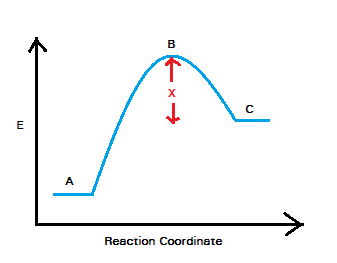
According to the information provided in the passage, how can we describe the activation energy needed to initiate the reaction in Example 1?
More information is necessary
The total energy released from the reaction vessel
The difference in energy between points A and C
The difference in energy between points A and B
The difference in energy between points B and C
The difference in energy between points A and B
The correct answer is that it is the difference in energy between points A and B. As stated in the passage, B is the point in the reaction that is reached immediately after the activation energy has been applied to the system. The difference between the energy at B and the energy it originally had at A is therefore the energy that was added--the activation energy.
Example Question #31 : How To Find Synthesis Of Data In Chemistry
A chemist has mixed up the labels on some of his chemical compounds. To try to determine the compounds, the chemist dissolves the compounds in pure water. He notes the pH, corrosiveness and the color of each solution.
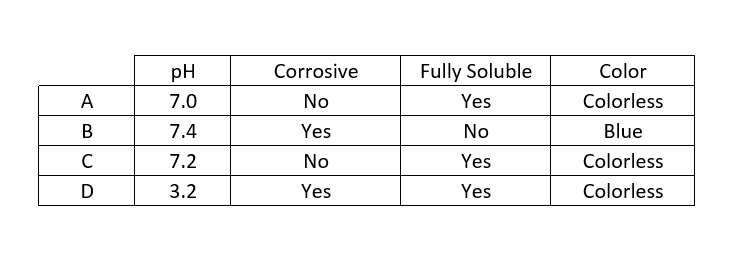
It is known that one of the compounds is copper. Which one of these compounds can potentially be copper?
B
More than one of these
D
C
A
B
All of the compounds except for compound B are colorless in solution. Copper is known to give off a blue color when dissolved in water. Therefore Compound B can potentially be copper and the others cannot.

Certified Tutor

Certified Tutor

All ACT Science Resources

