ACT Science : Biology
Study concepts, example questions & explanations for ACT Science


All ACT Science Resources
Example Questions
Example Question #21 : How To Find Data Representation In Biology
An experiment was done to look at the effects of iodine supplements on the production of the thyroid hormone thyroxine. Individuals in the study were divided into categorizes based on the dosage of iodine supplemented. The chart below summarizes the data collected. THY1 is the average amount of thyroxine in the group prior to taking the supplement. THY2 is the average amount of thyroxine in the group after three months of taking supplements.
|
|
THY1 |
Dosage of Iodine |
THY2 |
|
Group 1 |
3.220 |
0 |
3.289 |
|
Group 2 |
2.988 |
0 |
3.102 |
|
Group 3 |
3.134 |
1mmg |
3.248 |
|
Group 4 |
3.387 |
3mmg |
4.001 |
|
Group 5 |
3.024 |
6mmg |
5.830 |
According to the chart, which dosage of Iodine seems most effective at raising thyroxine levels?
3mmg
cannot be determined
0
6mmg
1mmg
6mmg
Individuals recieving the 6mmg dosage had thyroxine levels change from 3.024 to 5.830.
Example Question #21 : Biology
A biologist wanted to do an experiment involving two species of large cat (species A and species B) around a potential new food source.
He isolated the populations of each cat in a location that closely approximated their natural environment, except this potential new food source was the only food source available to them.
Experiment 1:
When species A was left alone with the new food source, their numbers decreased rapidly until none were left.
Experiment 2:
When species B was left alone with the new food source, their numbers increased and the species flourished.
Experiment 3:
When an equal number of species A and B were placed with the new food source, both species maintained relatively constant numbers.
Which of the following charts could not be used to illustrate the results of experiment 1?
Line graph
Scattered X-Y plot
Bar graph
Pie chart
Pie chart
Experiment 1 measures the change in population over time when in the presence of the food source. The independent variable is time, and the dependent variable is the population size.
A bar graph, line plot, or scatter plot could be used to illustrate the relationship between population and time over multiple data points. These could all show the trend of decreasing population size, until it reached zero.
Pie charts help illustrate percents of a whole, but are unable to show the relationship between population and time over several points.
Example Question #21 : Biology
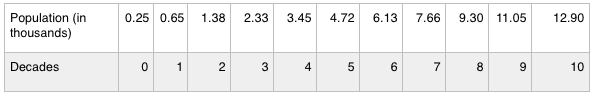
There is a certain species of rabbit that is known to reproduce quickly. 250 of these rabbits were introduced into a new environment, and their population was measured in ten year intervals.
What is the dependent variable in this experiment?
Decade
Species of rabbit
Population
Environment
Population
The dependent variable is the "output." In the case of this experiment, the scientists measure the population at regular intervals. The intervals are the independent variable, as they are directly controlled by the scientists and do not depend on the experiment. The population varies depending on the amount fo time that has passed, and cannot be directly controlled by the scientists; thus, population is the dependent variable.
Example Question #22 : Biology
There is a certain species of rabbit that is known to reproduce quickly. 250 of these rabbits were introduced into a new environment, and their population was measured in ten year intervals.
Which of the following is an accurate graphic representation of the data?


The correct answer starts at 0.25, since the initial population is greater than zero, and increases correctly with the table of information. Population trends are usually exponential, which also helps us determine our answer.
Example Question #22 : Biology
Which represents a population in which organisms tend to exhibit phenotypes on the bottem end of the scale?


This is the correct answer because the hump occurs on the left side of the scale. Conventionally this would represent the lower end of phenotypic expression (lower than the mean). The bell curve represents a normal distribution, the triple hump curve is a multimodal distribution, and the choice with the hump to the right side indicates a sample in which the population expresses phenotypes on the end greater than the mean.
Example Question #26 : Act Science
Species competition is driven by a variety of factors. Resources such as water, food, sunlight, and suitable habitat are among the top contributors that influence interspecific and intraspecific competition. Interspecific is competition between different species and intraspecific competition is between members of the same species.
One interesting example of interspecific completion is that of two barnacle species that inhabit intertidal zones. Balanus balanoides inhabits the lower intertidal zone and Chthamalus stellatus inhabits the lower intertidal zone. A researcher attempts to study this phenomenon.
The researcher removes the Balanus species from the lower intertidal zone and observes that the Chthamalus species expands its range to inhabit the lower intertidal zone and the upper intertidal zone. The researcher then removes the Chthamalus species from the upper tidal zone of a different area and observes that the Balanus species does not extend its range. The researcher concludes that competition has allowed each species to exist simultaneously by forming specialized niches that promotes survivorship for each species.
The interaction between Balanus balanoides and Chthamalus stellatus is best described as which of the following choices.
Intraspecific competition
Interspecific competition
None of the choices are correct.
Symbiosis
Interspecific competition
Interspecific competition
This is the correct answer because it is competition between two different barnacle species not one species, which would be described as intraspecific competition. Symbiosis is incorrect because it describes a relationship between two organisms in which each benefits from the other in some way. None of the other answers are supported by the passage.
Example Question #27 : Act Science
Eukaryotic cells first appeared billions of years ago and were marked by the presence of membrane-bound organelles (organelles with a lipid bilayer surrounding them) similar to the outer and inner membranes of prokaryotes like bacteria. One of these membrane bound organelles is called the mitochondrion, which is responsible for helping generate energy in the form of a nucleotide-sugar molecule called adenosine triphosphate (also known as ATP).
By using only oxygen and glucose (a type of sugar composed of a single molecule) as reactants, the mitochondrion is responsible for generating ATP and water. In order to make ATP, animals must eat food products that contain sugars, such as potatoes, which contain molecules called starches that have many sugar molecules linked together. Once the sugar has been processed in the cell by an enzyme called amylase, it undergoes a process called glycolysis, which breaks down glucose into a molecule called pyruvate and provides 2 ATP molecules in the process.
After glycolysis, the pyruvate molecule is transported to the mitochondrion, carried across its membrane and then enters a process called the Kreb’s cycle, where a net of 34 ATP are produced. However, the process of transporting the pyruvate molecule into the mitochondrion requires 1 ATP. The ATP produced from both glycolysis and the Kreb’s cycle serves to allow the cell to carry out its housekeeping functions.
If a mutation inactivated amylase, how many ATP could be produced from one glucose molecule through the combination of glycolysis and the Kreb's Cycle?
35
34
2
0
0
The passage tells us that the enzyme amylase functions to "process" starch into units that can then enter glycolysis. Also from the passage, we know that only individual glucose monomers can enter into glycolysis. Thus, the function of amylase is to break starch down into glucose. Without this ability, no glucose is available to enter into glycolysis and the Kreb's Cycle, so no ATP can be produced.
Example Question #21 : Act Science
Which of the following represents a normal distribution?


The bell shaped curve is the correct answer. A line represents no distribution along the y axis. The other two choices are bi- and multi-modal distributions.
Example Question #24 : Biology
Which represents a population that has more than two modes of phenotypic expression?
This is the only correct choice. This distribution represents a population that has more than two modes that the populations express. The line indicates no range in the y direction. The hump to the right represents a population that expresses traits on the upper end of the scale. Last, the two-hump line represents a population that possesses two modes of phenotypic expression.
Example Question #23 : Act Science
Passage I
An endocrinologist is a doctor who studies, diagnoses, and treats patients with hormone imbalances. There are many hormones involved in daily functioning. Two of the most important hormones for digestion are insulin and glucagon. These hormones are secreted by the pancreas. Insulin is released after a meal to help body cells take in sugar and covert it to energy. Glucagon is released when the body needs more energy, such as during exercise, and causes body cells to secrete sugar into the blood. A team of endocrinologists performed the following experiments:
Experiment 1
Five participants were given 15 grams of pure glucose (sugar). The participants had not eaten for four hours prior to the experiment. All five participants were healthy and had no serious medical conditions. A team of endocrinologists monitored the blood sugar and insulin levels of the participants over time. Figure 1 is a graph of the average levels in the five participants.

Experiment 2
Two participants were given 15 grams of pure glucose (sugar). The participants had not eaten for four hours prior to the experiment. One participant was healthy and the other had a hormone disease. Figure 2 is a graph of the blood sugar levels of the participants over time.

Which participant in Figure 2 has an endocrine disease?
Participant A
Participant B
Participant B
The descriptions for Experiment 1 and Experiment 2 specify the requirements for participation. Experiment 1 included all healthy individuals while Experiment 2 included one healthy and one unhealthy participant. Comparing the graphs of glucose concentration from Experiment 1 and Experiment 2, the graph of Participant A's concentration most closely resembles the graph from Experiment 1. Therefore, it is most likely that Participant B has an endocrine disease.


All ACT Science Resources

