All ACT Math Resources
Example Questions
Example Question #15 : How To Graph A Function
Which of the following graphs represents the y-intercept of this function?


Graphically, the y-intercept is the point at which the graph touches the y-axis. Algebraically, it is the value of 

Here, we are given the function 


So the y-intercept is at 
Example Question #653 : Geometry
Which of the following graphs represents the x-intercept of this function?


Graphically, the x-intercept is the point at which the graph touches the x-axis. Algebraically, it is the value of 

Here, we are given the function 


So the x-intercept is at 
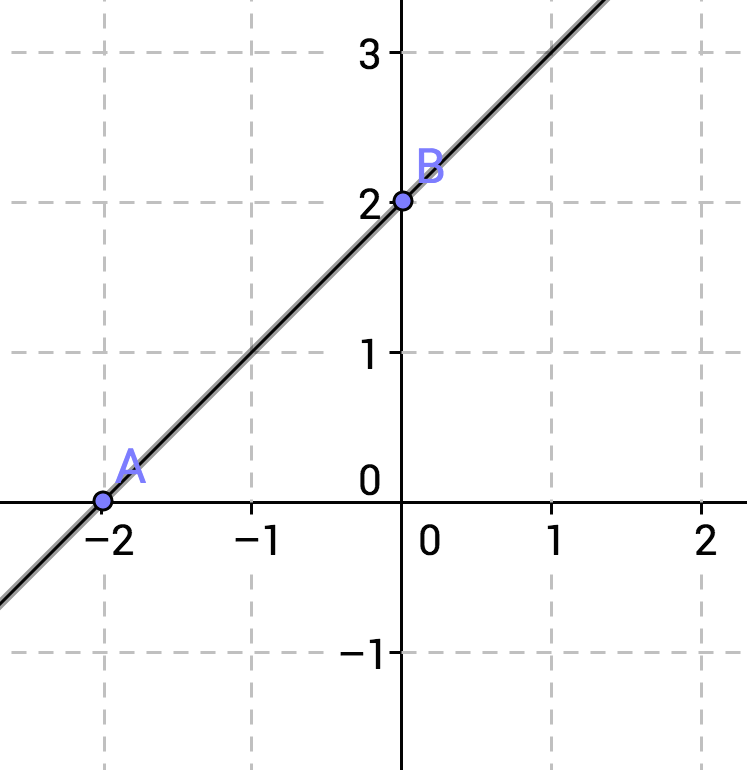
Example Question #16 : How To Graph A Function
Which of the following represents 


A line is defined by any two points on the line. It is frequently simplest to calculate two points by substituting zero for x and solving for y, and by substituting zero for y and solving for x.
Let 
So our first set of points (which is also the y-intercept) is
Let 
So our second set of points (which is also the x-intercept) is 
Example Question #21 : Graphing
Suppose 
To obtain the graph of 


To the left
Upwards
Up and right
Downwards
To the right
Upwards
There are four shifts of the graph y = f(x):
y = f(x) + c shifts the graph c units upwards.
y = f(x) – c shifts the graph c units downwards.
y = f(x + c) shifts the graph c units to the left.
y = f(x – c) shifts the graph c units to the right.
Example Question #211 : Algebra
Which of the following graphs does NOT represent a function?


All of the graphs are functions.

This question relies on both the vertical-line test and the definition of a function. We need to use the vertical-line test to determine which of the graphs is not a function (i.e. the graph that has more than one output for a given input). The vertical-line test states that a graph represents a function when a vertical line can be drawn at every point in the graph and only intersect it at one point; thus, if a vertical line is drawn in a graph and it intersects that graph at more than one point, then the graph is not a function. The circle is the only answer choice that fails the vertical-line test, and so it is not a function.
Example Question #1 : How To Graph A Point
How would you plot the point 
From the origin, go right 

From the origin, go right 

From the origin, go up 

From the origin, go left 

From the origin, go right 

For the ordered pair
The first number is for the x-axis, so because it is positive you go right 
The second number is for the y-axis, so because it is positive you go up 
Example Question #2 : How To Graph A Point
How would you plot the point 
From the origin, go right 

From the origin, go right 

From the origin, go left 

From the origin, go left 

From the origin, go left 

For the ordered pair 
The first number is for the x-axis, so because it is negative you go left 
The second number is for the y-axis, so because it is positive you go up 
Example Question #212 : Algebra
In which Quadrant is the point 
Quadrant IV
Quadrant II
Quadrant III
Quadrant I
Quadrant III
To find out which quadrant a point lives in, we need to remember the qualities of each quadrant. By qualities, I mean the signs associated with the x and y values which are dependent on the quadrant the point resides in.
All coordinate pairs that are in Quadrant I will have a positive x value and a positive y value.
All coordinate pairs that are in Quadrant II will have a negative x value and a positive y value.
All coordinate pairs that are in Quadrant III will have a negative x value and a negative y value.
All coordinate pairs that are in Quadrant IV will have a positive x value and a negative y value.
For the point 
Example Question #4 : How To Graph A Point
What are the coordinates of point B?

Find the x-coordinate by going right on the horizontal x-axis until you come across the line that is directly under the point. The x-coordinate is 
Now, continue up until you reach the point and look across to the vertical y-axis. The y-coordinate is 

Example Question #1 : How To Graph A Point
What are the coordinates for point A?

Find the x-coordinate by going right on the horizontal x-axis until you come across the line that is directly under the point. The x-coordinate is 
Now, continue up until you reach the point and look across to the vertical y-axis. The y-coordinate is 

Certified Tutor
Certified Tutor
All ACT Math Resources


