Trigonometry : Trigonometric Functions and Graphs

Study concepts, example questions & explanations for Trigonometry

varsity tutors app store varsity tutors android store

Example Questions

Example Question #3 : Graphing Tangent And Cotangent

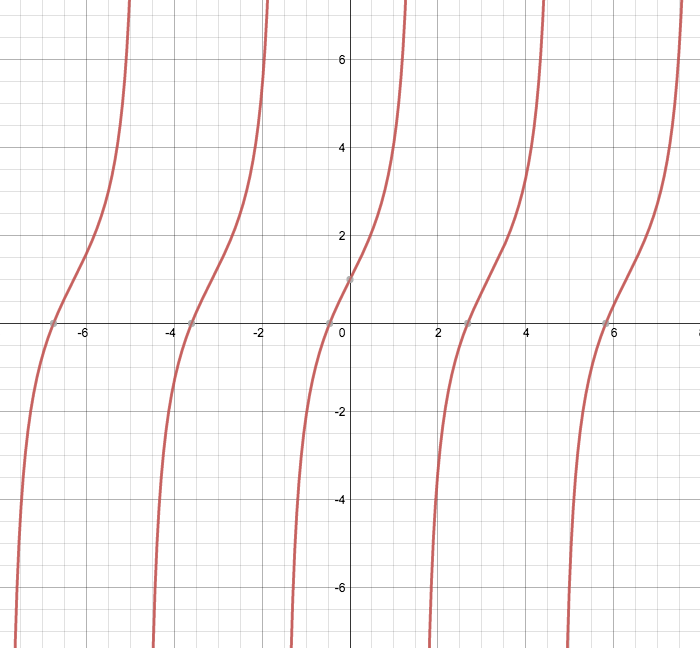
The following is a graph of which function?


Screen shot 2015 07 20 at 12.13.22 pm

Possible Answers:

Correct answer:

Explanation:

The graph looks to have infinite range, but multiple vertical asymptotes. That means we can limit our choices to tangent and cotangent graphs.

Furthermore, we observe that the graph starts at the bottom and increases from left to right, consistent with tangent graphs. So we narrow our focus to the choices involving tangents.

To decide between the remaining two graphs, observe that y-intercept (where x=0) of our graph is (0,1).

Now   evaluated at  is , which means that we need a vertical shift of  unit.

Hence the best choice is:


Example Question #4 : Graphing Tangent And Cotangent

Which of the following is the graph of ?

Possible Answers:

Screen shot 2020 08 27 at 3.44.04 pm

Screen shot 2020 08 27 at 3.44.11 pm

Screen shot 2020 08 27 at 3.42.14 pm

Screen shot 2020 08 27 at 3.40.13 pm

Correct answer:

Screen shot 2020 08 27 at 3.42.14 pm

Explanation:

To derive the graph of  , recall that .  The graph of   is

Screen shot 2020 08 27 at 3.40.13 pm

and the graph of is

Screen shot 2020 08 27 at 3.40.18 pm

Vertical asymptotes will occur in the graph of   whenever .  This is because the denominator of the tangent function will be equal to zero whenever the cosine function is equal to zero and then the entire function will be undefined at those points.  Wherever cosine crosses the x-axis a vertical asymptote will occur.  If we overlay the sine and cosine graphs we see the following:

Screen shot 2020 08 27 at 3.40.24 pm

So our tangent graph will follow the same form as the sine and cosine graphs when they are increasing, but will have vertical asymptotes wherever cosine crosses the x-axis.

Screen shot 2020 08 27 at 3.42.06 pm

And we are left with our graph of 

Screen shot 2020 08 27 at 3.42.14 pm

Example Question #5 : Graphing Tangent And Cotangent

Which of the following is the graph of ?

Possible Answers:

Screen shot 2020 08 27 at 11.40.46 am

Screen shot 2020 08 27 at 11.40.35 am

Screen shot 2020 08 27 at 11.40.40 am

Screen shot 2020 08 27 at 11.37.25 am

Correct answer:

Screen shot 2020 08 27 at 11.40.35 am

Explanation:

We will begin by considering the general graph of  and apply transformations step by step to produce a graph of .  The graph of  is

Screen shot 2020 08 27 at 11.37.25 am

The general equal of a tangent transformation equation is .  A is the amplitude of the graph of tangent.  Here,  so we do not need to apply a transformation here.  Next, we will consider the period.  The period of the tangent function is equal to .  So the period of our graph would be

Period = 

Period = 

So the period is shortened from  to .

Screen shot 2020 08 27 at 11.38.22 am

Now, we will consider  is the phase shift of our graph.  So we will shift our graph  units to the left.  This does not change our graph visually due to the period now being .  Lastly, we will consider  is the vertical shift of our graph, and so we must shift our graph 1 unit up.

Screen shot 2020 08 27 at 11.38.55 am

And we are left with the graph of 

Screen shot 2020 08 27 at 11.39.32 am

Example Question #6 : Graphing Tangent And Cotangent

Which of the following is the graph of ?

Possible Answers:

Screen shot 2020 08 27 at 2.16.51 pm

Screen shot 2020 08 27 at 2.18.25 pm

Screen shot 2020 08 27 at 2.16.42 pm

Screen shot 2020 08 27 at 2.18.30 pm

Correct answer:

Screen shot 2020 08 27 at 2.16.51 pm

Explanation:

To derive the graph of  recall that .  So the tangent and cotangent graphs are reciprocals of one another.  We will consider the tangent graph since it is one we are more familiar with:

Screen shot 2020 08 27 at 2.16.42 pm

Now we will simply invert the tangent graph to get the cotangent graph

Screen shot 2020 08 27 at 2.16.46 pm

And we are left with our cotangent graph

Screen shot 2020 08 27 at 2.16.51 pm

Example Question #7 : Graphing Tangent And Cotangent

Which of the following is the graph of .

Possible Answers:

Screen shot 2020 08 27 at 11.12.03 am

Screen shot 2020 08 27 at 11.12.10 am

Screen shot 2020 08 27 at 11.11.11 am

Screen shot 2020 08 27 at 11.11.56 am

Correct answer:

Screen shot 2020 08 27 at 11.11.11 am

Explanation:

First, we will consider the graph of  and apply transformations step-by-step.  The graph of  is

Screen shot 2020 08 27 at 11.08.57 am

The general form of a cotangent transformation function is .  For our function ,  and so we need to increase the amplitude 4 units.

Screen shot 2020 08 27 at 11.09.39 am

 here so we do not need to make any changes to the period of this graph.  , giving us a negative phase shift of  units.

Screen shot 2020 08 27 at 11.10.16 am

This leaves us with our graph of .

Screen shot 2020 08 27 at 11.11.11 am

Example Question #81 : Trigonometric Functions And Graphs

True or False: The period of tangent and cotangent function is .

Possible Answers:

True

False

Correct answer:

True

Explanation:

This is because  and   causing the tangent function to be undefined at these points and forming a vertical asymptote.  This is also true for the cotangent function because  so wherever  is zero or undefined, cotangent will be as well.

Example Question #1 : Graphs Of Inverse Trigonometric Functions

True or False: The inverse of the function  is also a function.

Possible Answers:

True

False

Correct answer:

False

Explanation:

 Consider the graph of the function .  It passes the vertical line test, that is if a vertical line is drawn anywhere on the graph it only passes through a single point of the function. This means that  is a function.

Screen shot 2020 08 27 at 11.59.46 am

Now, for its inverse to also be a function it must pass the horizontal line test. This means that if a horizontal line is drawn anywhere on the graph it will only pass through one point.

Screen shot 2020 08 27 at 12.00.18 pm

This is not true, and we can also see that if we graph the inverse of  () that this does not pass the vertical line test and therefore is not a function.  If you wish to graph the inverse of , then you must restrict the domain so that your graph will pass the vertical line test.

Screen shot 2020 08 27 at 12.00.40 pm

Example Question #1 : Graphs Of Inverse Trigonometric Functions

Which of the following is the graph of the inverse of  with ?

Possible Answers:

Screen shot 2020 08 27 at 10.47.06 am

Screen shot 2020 08 27 at 10.45.10 am

Screen shot 2020 08 27 at 10.46.15 am

Screen shot 2020 08 27 at 10.47.13 am

Correct answer:

Screen shot 2020 08 27 at 10.46.15 am

Explanation:

Note that the inverse of  is not , that is the reciprocal.  The inverse of  is  also written as .  The graph of  with  is as follows.

Screen shot 2020 08 27 at 10.45.10 am

And so the inverse of this graph must be the following with  and 

Screen shot 2020 08 27 at 10.46.15 am

Example Question #3 : Graphs Of Inverse Trigonometric Functions

Which best describes the easiest method to graph an inverse trigonometric function (or any function) based on the parent function?

Possible Answers:

The  and  values are switched so where  for the parent function,  for the inverse function.

Let  so where  for the parent function,  for the inverse function.

The  values are swapped with  so where  for the parent function,  for the inverse function.

Let  so where  for the parent function  for the inverse function.

Correct answer:

The  and  values are switched so where  for the parent function,  for the inverse function.

Explanation:

To find an inverse function you swap the and values.  Take  for example, to find the inverse we use the following method.


 (swap the  and  values)

(solving for )


Example Question #2 : Graphs Of Inverse Trigonometric Functions

Which of the following represents the graph of  with  ?

Possible Answers:

Screen shot 2020 08 28 at 9.01.00 am

Screen shot 2020 08 28 at 9.02.30 am

Screen shot 2020 08 28 at 9.02.37 am

Screen shot 2020 08 28 at 9.00.48 am

Correct answer:

Screen shot 2020 08 28 at 9.01.00 am

Explanation:

 If we are looking for the graph of  with , that means this is the inverse of   with .  The graph of  with  is

Screen shot 2020 08 28 at 9.00.48 am

Switching the  and   values to graph the inverse we get the graph

Screen shot 2020 08 28 at 9.01.00 am

Learning Tools by Varsity Tutors