SAT II Math II : Data Analysis and Statistics
Study concepts, example questions & explanations for SAT II Math II


All SAT II Math II Resources
Example Questions
Example Question #501 : Sat Subject Test In Math Ii
What is the probability of choosing 2 67's in a row out of the following data set? Assume replacement.


What is the probability of choosing 2 67's in a row out of the following data set? Assume replacement.

Let's begin by recalling that probability can be thought of as follows:

Meaning that the probability of an event is the number of times the desired outcome exists, over the total number of outcomes.
In this case, each pick has two possible desired outcomes, and 9 total outcomes. (there are two 67's, and 9 total terms).
So the probability of each choice being a 67 is:

However, we are not done yet. We need the probability of choosing two 67's in a row. Assuming replacement means that each probability will be the same, so to find the probability of events, we will multiply each probability together. This gets:

Example Question #502 : Sat Subject Test In Math Ii
A fair coin is tossed 4 times. What is the total number ways the results can be observed (ie HHHH, HHHT, HHTH.....).


In general, the number of outcomes that can be observed when flipping a coin is found using the formula 

Alternatively, if n is small enough you can list out the possible outcomes:
1. HHHH
2. HHHT
3. HHTH
4. HTHH
5. THHH
6. HHTT
7. HTHT
8. HTTH
9. THTH
10. TTHH
11. THHT
12. TTTH
13. TTHT
14. THTT
15. HTTT
16. TTTT
Example Question #503 : Sat Subject Test In Math Ii
In a carnival game, a player must spin two independent spinners. If the first spinner has a probability of 


Since the spinners are independent of each other, we will need to multiply the probability of not landing on red on the first spinner and the probability of landing on red on the second spinner together.
The probability of not landing on red for the first spinner is found by subtracting the probability of landing on red from 
}=1-\frac{2}{7}=\frac{5}{7}")
Thus,
(\frac{3}{8})=\frac{15}{56}")
Example Question #31 : Data Analysis And Statistics
Suppose there is a bag of marbles. There are two reds, two greens, and one orange marbles. Without replacement, what is the probability of choosing a red, and another red?


There are five marbles altogether.
The first marble is a red, which is two of the five marbles in the bag.
The probability of choosing a red for the first trial is:

Without replacement, there are four marbles remaining, and only one red marble remains.
The probability of choosing a red for the second trial is:

Multiply the two probabilities.

The answer is:

Example Question #31 : Data Analysis And Statistics
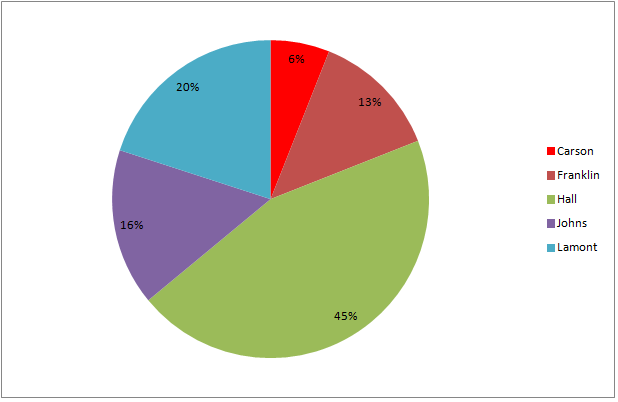
The above graph represents the results of a general election for mayor of Kingston.
If 1,658 people voted for Carson, then which comes closest to the number of people who voted for Franklin?


The ratio of Franklin's percent of the vote to Carson's is the same as the number of votes for Franklin to those for Carson. From the information in the graph, setting 

Multiply both sides by 1,658 and solve:


The closest estimate would be 3,600 votes.
Example Question #2 : Representing Data
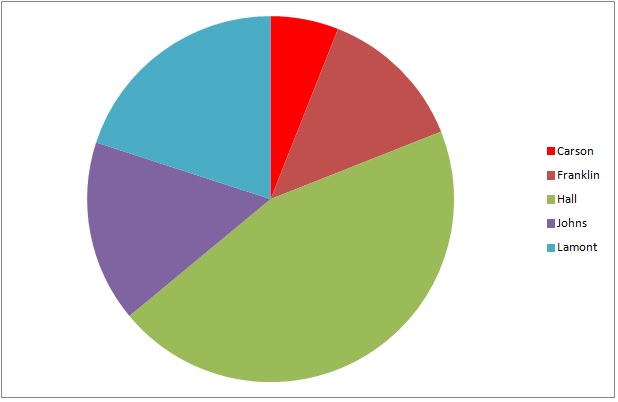
The above graph represents the results of a general election for mayor of Kingston.
If 8,349 people voted, which of the following numbers is closest to the number of voters who did not vote for the winning candidate?


The four wedges representing the four nonwinners - all except the largest wedge, which is green - together make up slightly more than half the circle. 55% is a good estimate, and 55% of 8,349 is equal to

The best estimate of the given choices is 4,600.
Example Question #1 : Other Data Analyses

Refer to the above diagram. Maureen achieved a score of 603, which was the lowest score in the 601-700 range. Which of the following comes closest to being her percentile score?


The histogram represents a total of

Maureen's percentile is the percent of the scores that she outscored. Those scores were exactly the ones in the first four intervals shown - that is,


Percentile is given in whole numbers, so round this to 78.
Example Question #502 : Sat Subject Test In Math Ii
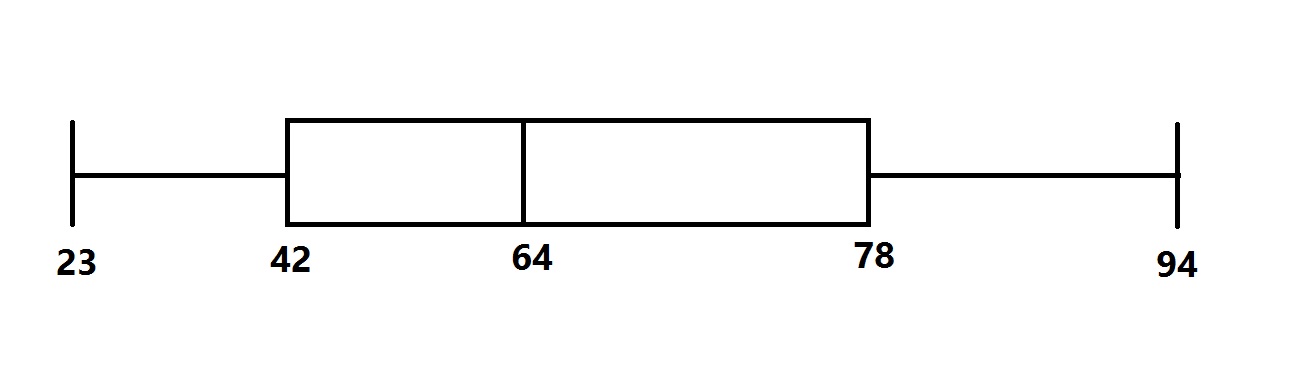
The distribution of scores for a test given to a large group of students is represented by the above box-and-whisker plot.
Which of the following questions cannot be answered from the diagram without looking for other information?
What is the range of the test scores?
What is the median of the test scores?
What is the interquartile range of the test scores?
What is the mean of the test scores?
What is the midrange of the test scores?
What is the mean of the test scores?
The midrange of the scores is the mean of the least and greatest scores, which are represented by the "whiskers" at either end:

The range of the scores is the difference of the least and greatest scores:

The median of the scores is represented by the vertical line within the box -

The interquartile range is the difference of the third and first quartiles, which are represented by the ends of the box:

Note that these scores all depend on the positions of the scores. The mean, however, depends on the scores themselves, which are not reflected in the diagram. The question cannot be answered from the box-and-whisker plot.
Example Question #2 : Other Data Analyses
Refer to the above diagram. Which of the following scores could possibly be at the eightieth percentile?


The histogram represents a total of


This score would outrank the

scores in the first four ranges graphed, but not all of the

scores in the first five ranges.
This score must fall in the fifth range shown, which is the 601-700 range.
Therefore, the correct choice of the ones given is 620.

Certified Tutor

All SAT II Math II Resources

