SAT II Math I : Representing Data
Study concepts, example questions & explanations for SAT II Math I


All SAT II Math I Resources
Example Questions
Example Question #1 : Representing Data
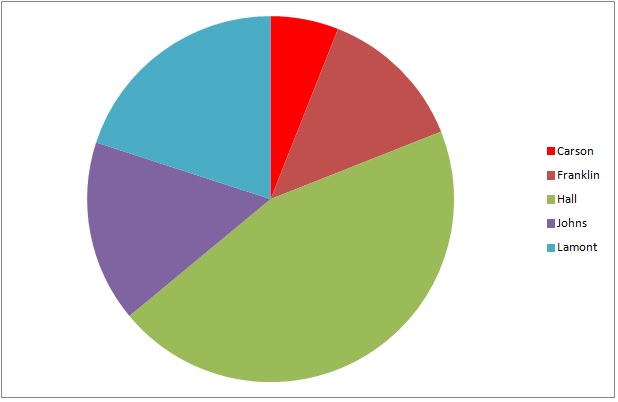
The above graph represents the results of the student body election at Big State College.
Who finished fourth?
Johns
Carson
Lamont
Franklin
Hall
Franklin
The wedges, in descending order of size, are the ones that are green, blue, purple, dull red, and bright red. The dull red wedge, which, according to the legend, represents Franklin, is the fourth-largest.
Example Question #2 : Representing Data
The above graph represents the results of a general election for two seats on the city council of Wilson City. Franklin and Hall are Democrats; Johns and Lamont are Republicans; Carson is an independent.
5,310 people voted for Democrats. Which of the following is the best estimate of the number of people who voted in the election overall?


The two wedges that represent the Democratic candidates - green (Hall) and deep red (Franklin) - make up about 55% of the circle. The problem becomes, essentially, to figure out what 5,310 is 55% of. This can be done by dividing 5,310 by 0.55:

9,700 is the best estimate.

Certified Tutor

Certified Tutor

All SAT II Math I Resources

