PSAT Math : How to find mode
Study concepts, example questions & explanations for PSAT Math


All PSAT Math Resources
Example Questions
Example Question #1 : Mode
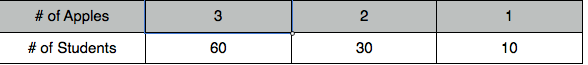
Looking at the table, what is the difference of the mean minus the mode.
–0.5
1.0
–1.0
0.5
–0.5
The mode is 3 and subtracting 3 from 2.5 gives -0.5.
Example Question #1 : How To Find Mode
Find the mode of the following set of numbers:
1, 6, 3, 6, 5, 9
8
9
5
6
6
Mode is the most frequently occuring number in a set. 6 appears most frequently since there are 2 sixes but the rest of the numbers only appear once. The mode is 6
Example Question #2 : How To Find Mode
Find the mode in this set of numbers:
2, 100, 52, 97, 1, 7, 22, 19, 100
97
100
2
1
none of these
100
The mode is the number that appears the most
Example Question #1 : How To Find Mode
Find the mode from the following set of numbers
1, 4, 8, 17, 8, 8, 15, 21, 32, 17
4
15
21
8
17
8
The mode is the number that appears the most in a given set of numbers
Example Question #1 : How To Find Mode
Find the mode.


The mode is the number that appears the most often. 9 appears three times.
Example Question #102 : Statistics
What is the mode of the following set of numbers?
24, 38, 26, 27, 7, 27, 34, 12, 13


The mode is the number that appears the most in a given set of numbers.
Example Question #3 : How To Find Mode
Consider the following dataset:

The arithmetic mean of the dataset is 
The median of the dataset is 
The range of the dataset is 
The mode of the dataset is 
Which of the following statements is true?


In general:
 } = \dfrac{ \mbox{ sum of all values } }{ \mbox{ number of observations } }")
In this case the mean is:
+0+1+(-4)+6+(-2)+3}{7} = 0.286")
To obtain the median, arrange the observations from smallest to largest:

When there is an odd number of observations, the median is the middle value. In this case:

The range is the difference between the largest and smallest value:
 = 10")
The mode is the value that occurs most often in the dataset:

Since:

we can conclude:

Example Question #3 : How To Find Mode
|
Marker Colors |
Students |
|
Blue |
13 |
|
Pink |
10 |
|
Orange |
5 |
|
Brown |
5 |
|
Green |
7 |
The above chart shows the number of students in a class who chose each of the five marker colors available.
What is the mode of the above chart?


The mode of a problem is the most common number, i.e. the number that appears the most times in a given set of data. In this case, only one number is repeated. Therefore, the mode is 5.
Example Question #81 : Statistics
Find the mode(s) of the following set of numbers:


The mode is the most frequently represented number in a data set. In this instance, that is 

Example Question #1411 : Psat Mathematics
Find the mode of the following set of numbers:


The mode is the most frequently occurring number in a data set. In this instance, that is 

Certified Tutor


All PSAT Math Resources

