Precalculus : Graphs of Polynomial Functions
Study concepts, example questions & explanations for Precalculus


All Precalculus Resources
Example Questions
Example Question #1 : Graphs Of Polynomial Functions
For what values of 
=(x+2)^2(x-1)(x+3)(x-5)^3")


None of the other answers
One can remember that if the multiplicity of a zero is odd then it passes through the x-axis and if it's even then it 'bounces' off the x-axis. You can think about this analytically as well. What happens when we plug a number into our function just slightly above or below a zero with an even multiplicity? You find that the sign is always positive. Whereas a zero with an odd multiplicity will yield a positive on one side and a negative on the other. For zeros with odd multiplicity this alters the sign of our output and the function passes through the x-axis. Whereas the zero with even multiplicity will output a number with the same sign just above and below its zero, thus it 'bounces' off the x-axis.
Example Question #2 : Graphs Of Polynomial Functions
For this particular question we are restricting the domain of both 
")
Let =x^2+4")
 = x^3")
For what values of 
 > g(x)")
")
")

")
The cubic function will increase more quickly than the quadratic, so the quadratic function must have a head start. At 
The domain was restricted to nonnegative values, so this interval is our only answer.
Example Question #1 : Graphs Of Polynomial Functions
Which of the following is an accurate graph of  = -(x + 4)^{2}")
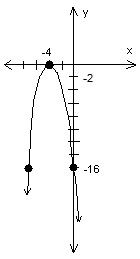
")
 = x^{2}")
 < 0")
Solving ^{2} = 0")
^{2}")
^{2}}")


The resulting x-axis intercept is: ")
Setting 
^{2}")
^{2}")
")

The resulting y-axis intercept is:
")
Example Question #71 : Graphing
Give the 
 = 5 \cdot 4^{x- 3}- 3")
Round to the nearest tenth, if applicable.
")
")
The graph has no 
")
")
The 
")
= 0")
 = 5 \cdot 4^{x- 3}- 3")


=\ln 0.6")
\ln 4 =\ln 0.6")


The 
")
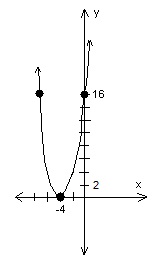
Example Question #3 : Graph A Polynomial Function
Graph the following function and identify the zeros.


This question tests one's ability to graph a polynomial function.
For the purpose of Common Core Standards, "graph polynomial functions, identifying zeros when suitable factorizations are available, and showing end behavior" falls within the Cluster C of "Analyze Functions Using Different Representations" concept (CCSS.MATH.CONTENT.HSF-IF.C.7).
Knowing the standard and the concept for which it relates to, we can now do the step-by-step process to solve the problem in question.
Step 1: Use algebraic technique to factor the function.

Separating the function into two parts...
+(-x+2)")
Factoring a negative one from the second set results in...
-(x-2)")
Factoring out 
-1(x-2)")
The new factored form of the function is,
(x-2)")
Now, recognize that the first binomial is a perfect square for which the following formula can be used
=(x-\sqrt{b})(x+\sqrt{b})")
since

thus the simplified, factored form is,
(x+1)(x-2)")
Step 2: Identify the roots of the function.
To find the roots of a function set its factored form equal to zero and solve for the possible x values.
(x+1)(x-2)=0 \\x-1=0\Rightarrow x=1 \\x+1=0\Rightarrow x=-1 \\x-2=0\Rightarrow x=2")
Step 3: Create a table of ")
 & y \\ \hline -2& f(-2) & -12 \\ -1 & f(-1) & 0 \\ 0&f(0)& 2\\ 1.5&f(1.5)&-0.625\\2&f(2)&0 \\ 3&f(3)&8 \\\hline \end{tabular}")
The values in the table are found by substituting in the x values into the function as follows.
=(-2)^3-2(-2)^2-(-2)+2=-8-8+2+2=-16+4=-12 \\f(-1)=(-1)^3-2(-1)^2-(-1)+2=-1-2+1+2=0 \\f(0)=(0)^3-2(0)^2-(0)+2=0-0-0+2=2 \\f(1.5)=(1.5)^3-2(1.5)^2-(1.5)+2=-0.625 \\f(2)=(2)^3-2(2)^2-(2)+2=8-8-2+2=0 \\f(3)=(3)^3-2(3)^2-(3)+2=27-18-3+2=8")
Step 4: Plot the points on a coordinate grid and connect them with a smooth curve.
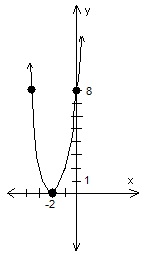
Example Question #4 : Graph A Polynomial Function
Graph the function and identify the roots.


This question tests one's ability to graph a polynomial function.
For the purpose of Common Core Standards, "graph polynomial functions, identifying zeros when suitable factorizations are available, and showing end behavior" falls within the Cluster C of "Analyze Functions Using Different Representations" concept (CCSS.MATH.CONTENT.HSF-IF.C.7).
Knowing the standard and the concept for which it relates to, we can now do the step-by-step process to solve the problem in question.
Step 1: Use algebraic technique to factor the function.
Recognize that the binomial is a perfect square for which the following formula can be used
=(\sqrt{a}x-\sqrt{b})(\sqrt{a}x+\sqrt{b})")
since

thus the simplified, factored form is,
(10x+1)")
Step 2: Identify the roots of the function.
To find the roots of a function set its factored form equal to zero and solve for the possible x values.


Step 3: Create a table of
 & y \\ \hline -1& f(-1) & 99 \\ 0 & f(0) & -1 \\ 1&f(1)& 99 \\\hline \end{tabular}")
The values in the table are found by substituting in the x values into the function as follows.
=100(-1)^2-1=100-1=99 \\f(0)=100(0)^2-1=0-1=-1 \\f(1)=100(1)^2-1=100-1=99")
Step 4: Plot the points on a coordinate grid and connect them with a smooth curve.
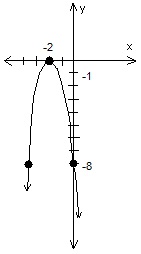
Example Question #5 : Graph A Polynomial Function
Graph the function and identify its roots.


This question tests one's ability to graph a polynomial function.
For the purpose of Common Core Standards, "graph polynomial functions, identifying zeros when suitable factorizations are available, and showing end behavior" falls within the Cluster C of "Analyze Functions Using Different Representations" concept (CCSS.MATH.CONTENT.HSF-IF.C.7).
Knowing the standard and the concept for which it relates to, we can now do the step-by-step process to solve the problem in question.
Step 1: Use algebraic technique to factor the function.
Recognize that the binomial is a perfect square for which the following formula can be used
=(\sqrt{a}x-\sqrt{b})(\sqrt{a}x+\sqrt{b})")
since

thus the simplified, factored form is,
(3x+4)")
Step 2: Identify the roots of the function.
To find the roots of a function set its factored form equal to zero and solve for the possible x values.


Step 3: Create a table of
 & y \\ \hline -2& f(-2) & 20 \\ -4/3 & f(-4/3) & 0 \\ 0&f(0)& -16\\ 1&f(1)&-7\\\hline \end{tabular}")
The values in the table are found by substituting in the x values into the function as follows.
=9(-2)^2-16=9(4)-16=36-16=20 \\f(-4/3)=9(-4/3)^2-16=16-16=0 \\f(0)=9(0)^2-10-16=-16 \\f(1)=9(1)^2-16=9-16=-7")
Step 4: Plot the points on a coordinate grid and connect them with a smooth curve.
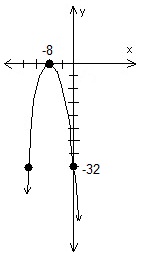
Example Question #6 : Graph A Polynomial Function
Graph the function and identify its roots.


This question tests one's ability to graph a polynomial function.
For the purpose of Common Core Standards, "graph polynomial functions, identifying zeros when suitable factorizations are available, and showing end behavior" falls within the Cluster C of "Analyze Functions Using Different Representations" concept (CCSS.MATH.CONTENT.HSF-IF.C.7).
Knowing the standard and the concept for which it relates to, we can now do the step-by-step process to solve the problem in question.
Step 1: Use algebraic technique to factor the function.
Recognize that the binomial is a perfect square for which the following formula can be used
since

thus the simplified, factored form is,
(2x+6)")
Step 2: Identify the roots of the function.
To find the roots of a function set its factored form equal to zero and solve for the possible x values.


Step 3: Create a table of
 & y \\ \hline -3& f(-3) & 0 \\ -1 & f(-1) & -32 \\ 0&f(0)& -36\\ 1&f(1)&-32\\3&f(3)&0 \\\hline \end{tabular}")
The values in the table are found by substituting in the x values into the function as follows.
=4(-3)^2-36=4(9)-36=36-36=0 \\f(-1)=4(-1)^2-36=4-36=-32 \\f(0)=4(0)^2-36=0-36=-36 \\f(1)=4(1)^2-36=4-36=-32 \\f(3)=4(3)^2-36=4(9)-36=36-36=0")
Step 4: Plot the points on a coordinate grid and connect them with a smooth curve.
Example Question #1 : Write The Equation Of A Polynomial Function Based On Its Graph
Which could be the equation for this graph?


This graph has zeros at 3, -2, and -4.5. This means that 


Our equation results from multiplying (x+2)(2x+9)")

Example Question #2 : Write The Equation Of A Polynomial Function Based On Its Graph
Write the quadratic function for the graph:

 = x^{2} + 12x + 3")
 = x^{2} + 6x - 12")
 = x^{2} - 6x + 12")
 = -x^{2} - 12x + 3")
 = -x^{2} - 6x - 12")
Because there are no x-intercepts, use the form  = (x - h)^{2} + k")
")
")


 = (x - 3)^{2} + 3")
(x - 3) + 3")
(x) + (-3)^{2} + 3")


Certified Tutor

Certified Tutor

All Precalculus Resources

