ISEE Upper Level Quantitative : Data Analysis and Probability
Study concepts, example questions & explanations for ISEE Upper Level Quantitative


All ISEE Upper Level Quantitative Resources
Example Questions
Example Question #11 : Data Analysis
What is the greatest common factor of 


To solve for the greatest common factor, it is necessary to get your numbers into prime factor form. For each of your numbers, this is:


Next, for each of your sets of prime factors, you need to choose the exponent for which you have the smallest value; therefore, for your values, you choose:


Taking these together, you get:

Example Question #12 : Data Analysis
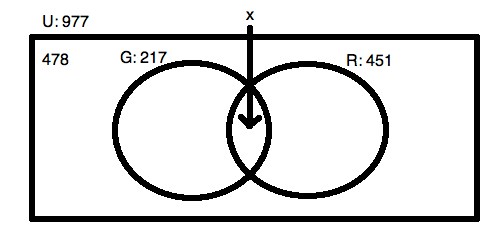
For the Venn Diagram pictured above, what is the value 


Solving for the overlap of two sets is easy when you have all of your data. You know that the two circles added up will have to equal 


Because the overlap happens once in each circle, you know that:

Given your data, you know:

Solving, this means:


Example Question #1 : How To Find The Common Part Of A Venn Diagram
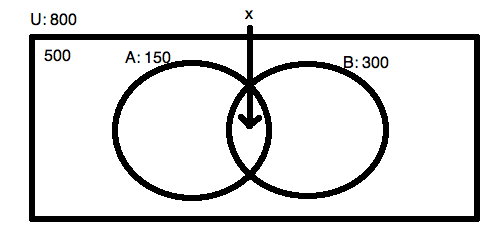
For the Venn Diagram pictured above, what is the value 


No answer possible.

Solving for the overlap of two sets is easy when you have all of your data. You know that the two circles added up will have to equal 


Because the overlap happens once in each circle, you know that:

Given your data, you know:

Solving, this means: 

Example Question #2 : How To Find The Common Part Of A Venn Diagram
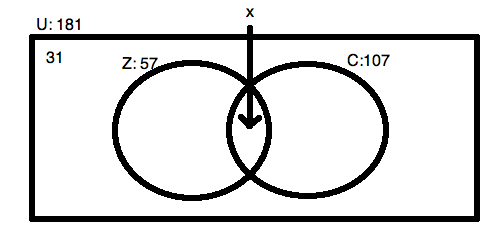
For the Venn Diagram pictured above, what is the value 


Solving for the overlap of two sets is easy when you have all of your data. You know that the two circles added up will have to equal 


Because the overlap happens once in each circle, you know that:

Given your data, you know:

Solving, this means:


Example Question #15 : Data Analysis
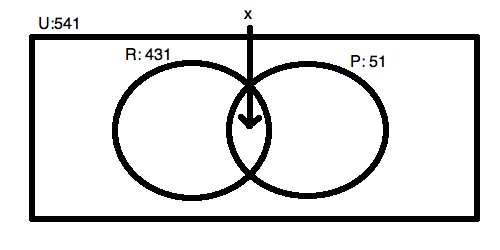
For the Venn Diagram pictured above, what is the value 


No answer is possible.


No answer is possible.
Do not be tricked by this question! In order to solve for the overlap, you need to know the amount that is in the area outside of the circles but still inside the universal box area! You cannot figure out the answer without knowing this fact; therefore, you must select "No answer is possible." We know that the two circles do not exhaust the universe because 


Example Question #1 : How To Find The Answer From A Table
The beverage menu from a coffeehouse reads as follows:

Eight friends go out for drinks. Three order cappucino, two order espresso, one orders Americano, one orders Turkish coffee, and one orders cafe latte. One of the eight agrees to leave the entire amount of the tip, which is to be 20% of the check. How much will be the amount of the tip (round to the nearest dime)?


The costs of the beverages will be as follows:

Add these amounts:

20% of this is

Example Question #1 : How To Find The Answer From A Table
Refer to the above circle graph. Which of these quantities is greater?
(a) The number of votes won by Hawley
(b) The number of votes won by Wells
(a) and (b) are equal
(b) is greater
It is impossible to tell from the information given
(a) is greater
(b) is greater
The gray portion of the circle graph represents Wells; the yellow portion represents Hawley. The gray portion is larger, so Wells won more votes, making (b) greater.
Example Question #1 : How To Find The Answer From A Table
Refer to the above circle graph. Which of these quantities is greater?
(a) The number of votes won by Creighton
(b) The number of votes won by either Barnes or Yale
(a) and (b) are equal
(b) is greater
(a) is greater
It is impossible to tell from the information given
(a) is greater
The size of the orange portion of the circle, which represents Creighton, is larger than the combined sizes of the dark blue and green portions, which represent Barnes and Yale, respectively. This makes (a) the greater quantity.
Example Question #1 : How To Find The Answer From A Table
The following is a portion of the menu at Moonbucks Coffee:

On this particular day, Moonbucks offers a 20% discount if four drinks of the same kind are purchased.
Which is the greater quantity?
(a) The price of four Turkish coffees
(b) The price of two Cafe Americanos and two lattes
(a) and (b) are equal
(b) is greater
(a) is greater
It is impossible to tell from the information given
(b) is greater
(a) The four Turkish coffees cost 


(b) The two Cafe Americanos cost 


This makes (b) the greater quantity.
Example Question #3 : How To Find The Answer From A Table
Refer to the above circle graph. Which of these quantities is greater?
(a) The number of students who voted
(b) The number of students who did not vote
(b) is greater
It is impossible to tell from the information given
(a) is greater
(a) and (b) are equal
It is impossible to tell from the information given
The above graph only reflects the relative numbers of students who voted for each of the six candidates; it does not give any information about the numbers of students who voted for each candidate, or the number of students who did not vote.


All ISEE Upper Level Quantitative Resources

