ISEE Primary 3 Math : Data Analysis and Probability
Study concepts, example questions & explanations for ISEE Primary 3 Math


All ISEE Primary 3 Math Resources
Example Questions
Example Question #1 : Data Analysis And Probability
Mrs. Ryan's class had their class election today for their class president. The results are displayed in the chart below.
Use the graph below to help answer the question.
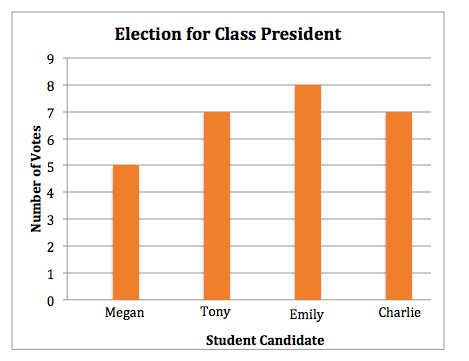
How many people voted for Megan?


The bar for Megan is the first bar on the left. The bar raises to the number 

Example Question #2 : Data Analysis And Probability
Kate's class is going to plant flowers outside of their class window. To help decide what flower to plant, her teacher took a class vote.
Use the graph below to help answer the question.
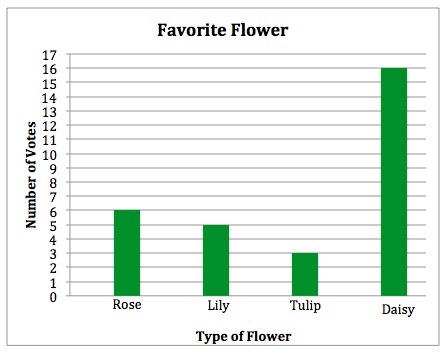
What is the label of the x-axis?
Favorite Flower
Kate's Class
Number of Votes
Type of Flower
Type of Flower
A graph is made up of an x-axis and a y-axis. The x-axis of a graph is always the horizontal line (a line that runs from left to right) and the y-axis is alway the vertical line (a line that runs from top to bottom)
The x-axis of this graph is labeled "Type of Flower".


All ISEE Primary 3 Math Resources

