All GRE Subject Test: Chemistry Resources
Example Questions
Example Question #1 : Calibrations And Precision
What is the molar concentration of a 2% by mass 

By definition, 2% by mass means 2 grams of 
In order to calculate the number of moles of 


In order to calculate molarity, we need to plug the moles and volumes calculated into the following equation:
Example Question #2 : Calibrations And Precision

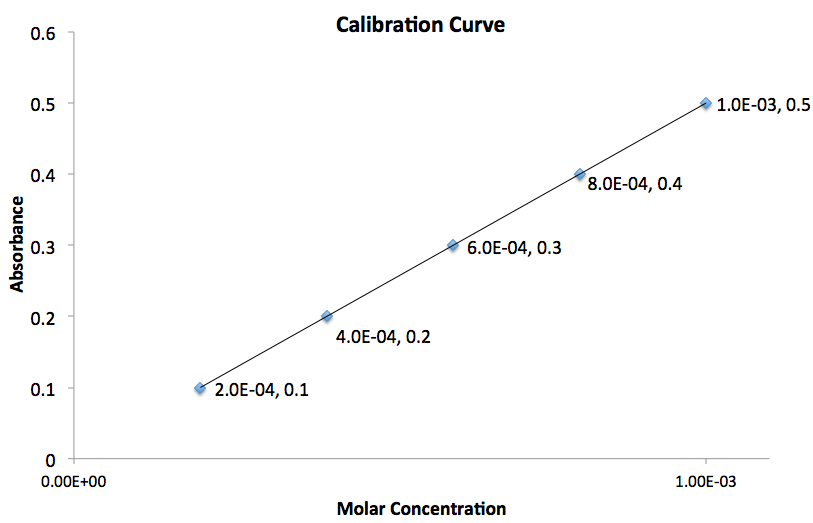
Using the calibration curve given, if given the absorbance of 1.51, what would be the concentration?
A calibration curve is a graph that gives the relationship between a measured quantity and an analytical signal. In this question the analytical signal is absorbance and the measured quantity is the concentration. To answer this problem, simply determine where the absorbance value 1.5 is on the y-axis and find what point the x-axis crosses this absorbance.
Example Question #1 : Other Statistics
![]()
Determine the percentage yield if the expected yield of 
In chemistry, percentage yield is a term used to quantify the efficiency of a chemical reaction. In order to calculate this quantity, the value for the actual yield and theoretical yield is needed. The actual yield is the amount of product obtained during a chemical reaction. The theoretical yield is the maximum amount of product possible to be obtain by a chemical reaction which is based on the amount of reactants used. Below is the formula needed to calculate the percentage yield.
Example Question #2 : Other Statistics
![]()
0.0031 moles of 


Therefore,

Example Question #3 : Other Statistics
![]()
Determine the percentage yield if the expected yield of 
In chemistry, percentage yield is a term used to quantify the efficiency of a chemical reaction. In order to calculate this quantity, the value for the actual yield and theoretical yield is needed. The actual yield is the amount of product obtained during a chemical reaction. The theoretical yield is the maximum amount of product possible to be obtain by a chemical reaction which is based on the amount of reactants used. Below is the formula needed to calculate the percentage yield.
Example Question #11 : Analyzing Data
Robert's work schedule for next week will be released today. Robert will work either 45, 40, 25, or 12 hours. The probabilities for each possibility are listed below:
45 hours: 0.3
40 hours: 0.2
25 hours: 0.4
12 hours: 0.1
What is the standard deviation of the possible outcomes?
There are four steps to finding the standard deviation of random variables. First, calculate the mean of the random variables. Second, for each value in the group (45, 40, 25, and 12), subtract the mean from each and multiply the result by the probability of that outcome occurring. Third, add the four results together. Fourth, find the square root of the result.
Example Question #12 : Analyzing Data
We have two independent, normally distributed random variables 


Normal distribution with mean 

Normal distribution with mean 

Normal distribution with mean 

Normal distribution with mean 

Normal distribution with mean 

The mean for any set of random variables is additive in the sense that
The difference is also additive, so we have
This means the mean of 

The variance is additive when the random variables are independent, which they are in this case. But it's additive in the sense that for any real numbers 

So for this difference, we have

So the mean and variance are 


Example Question #1 : Help With Quantification Techniques
A researcher performs a Bradford assay to determine the quantity of an unknown protein in his sample. The standard protein returns absorbance values of 0.101, 0.204, 0.302, 0.405 for the respective quantities of 10ug, 20ug, 30ug, and 40ug of protein. The unknown sample returns an absorbance value of 0.265. What is the quantity of protein in the unknown sample?
For this problem we need to determine the equation of our standard curve. This can be done by creating a graph from the data points and determining the slope.

Assuming that a sample of zero concentration will also have zero absorbance, we can find the equation for the line generated by finding the slope.
Pick two points on the line to find the slope. We will use (0,0) and (40,0.405).
Use this equation and the absorbance given in the question to find the concentration of the unknown sample.
Example Question #1 : Diagrams, Graphs, And Tables

Using the graph given, what is the value for the slope of the line?
The slope of the line, 
The subscripts are simply the points you chose in the order you arbitrarily chose.The most important thing to do is plug the values into equation in the order you chose them.
To determine the slope of the line we need to use two points on the graph. Assuming the two points chosen correspond to 

Therefore the slope of the line is equal to
Certified Tutor
Certified Tutor
All GRE Subject Test: Chemistry Resources


