Common Core: 1st Grade Math : Representing and Interpreting Data
Study concepts, example questions & explanations for Common Core: 1st Grade Math


All Common Core: 1st Grade Math Resources
Example Questions
Example Question #1 : Organize, Represent, And Interpret Data: Ccss.Math.Content.1.Md.C.4
Look at the chart below. What is there the most of?
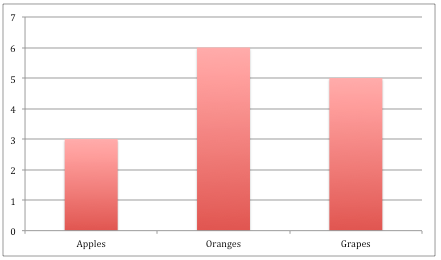
Oranges
Apples
Grapes
Oranges
There are 


Example Question #2 : Organize, Represent, And Interpret Data: Ccss.Math.Content.1.Md.C.4
Look at the chart below. How many apples are there?


In the chart, apples are shown in the first bar. That bar goes up to the number 

Example Question #3 : Organize, Represent, And Interpret Data: Ccss.Math.Content.1.Md.C.4
Look at the chart below. How many oranges are there?


In the chart, oranges are shown in the second bar. That bar goes up to the number 

Example Question #4 : Organize, Represent, And Interpret Data: Ccss.Math.Content.1.Md.C.4
Look at the chart below. How many grapes are there?


In the chart, grapes are shown in the last bar. That bar goes up to the number 

Example Question #5 : Organize, Represent, And Interpret Data: Ccss.Math.Content.1.Md.C.4
Look at the chart below. How many more oranges are there than apples?


There are 


Example Question #6 : Organize, Represent, And Interpret Data: Ccss.Math.Content.1.Md.C.4
Look at the chart below. If we add 


We are starting with 


Example Question #7 : Organize, Represent, And Interpret Data: Ccss.Math.Content.1.Md.C.4
Look at the chart below. If we add 


We are starting with 


Example Question #38 : How To Find The Answer From A Table
Look at the chart below. If we add 


We have 


Example Question #8 : Organize, Represent, And Interpret Data: Ccss.Math.Content.1.Md.C.4
Look at the chart below. If we take away 


We are starting with 


Example Question #9 : Organize, Represent, And Interpret Data: Ccss.Math.Content.1.Md.C.4
Look at the chart below. How many more grapes are there than apples?


There are 


All Common Core: 1st Grade Math Resources

