Calculus 1 : Other Graphing Differential Equations
Study concepts, example questions & explanations for Calculus 1


All Calculus 1 Resources
Example Questions
Example Question #8 : Differential Equations
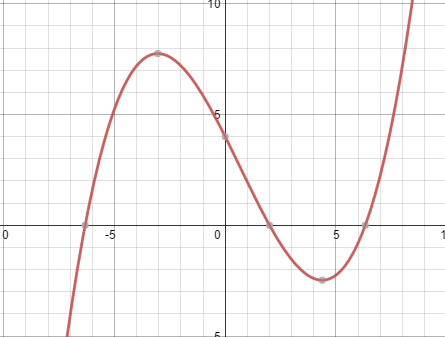
The function f(x) is shown here in the graph
Without solving for the derivative, which of the following graphs is the graph of the derivative of ")
")
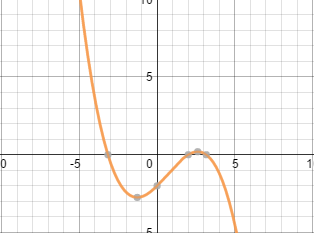
None of these graphs could be the derivative of ")
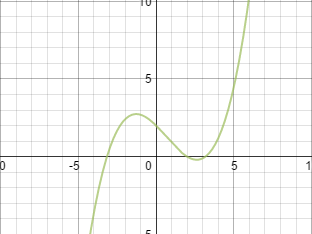
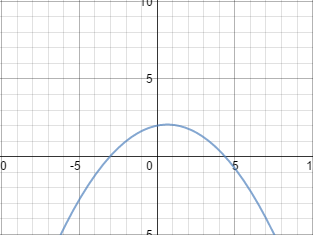
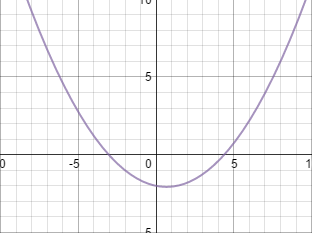
In order to determine the graph by inspection, there are key features to look for. The most important is the locations of the local maxima and minima in the graph of f(x). These points correspond to the x-intercepts in the graph of the derivative. Taking a look at the graph of f(x), you can see that the x intercepts on the graph of f'(x) will be located roughly at x = -3 and x = 4.5. Looking at the possible answers, the only two that could be graphs of f'(x) are these two:
and
The next step would then be to see which corresponds correctly to maxima and minima. Since the point at x = -3 is a local maximum, f(x) will increase up until the point at which it is maximum, then begin to drop. As seen in the positively oriented parabola, the rate of change of f(x) (the derivative) is positive up until it reaches x = -3. This means that f(x) was increasing, and indicates that this point was a local maximum. On the other hand, if you look at the graph on the left with the negatively oriented parabola, f'(x) is negative until it reaches the local maximum, which doesn't make sense, since that would mean it was decreasing up until the point and then increasing. This indicates a minima.
Since the point at x = -3 is a local maximum, the only graph that could be the derivative of f(x) is the positively oriented parabola.


Certified Tutor

All Calculus 1 Resources

