AP Chemistry : Calculations
Study concepts, example questions & explanations for AP Chemistry


All AP Chemistry Resources
Example Questions
Example Question #11 : Calculations
Working in the laboratory, a student finds the density of pure aluminum to be 


To find the percent error, the formula is:
} * 100")
Therefore we plug in the values given:
} * 100 = 5.595\%")
Therefore, the correct answer including significant figures is

Example Question #11 : Laboratory Techniques And Analysis
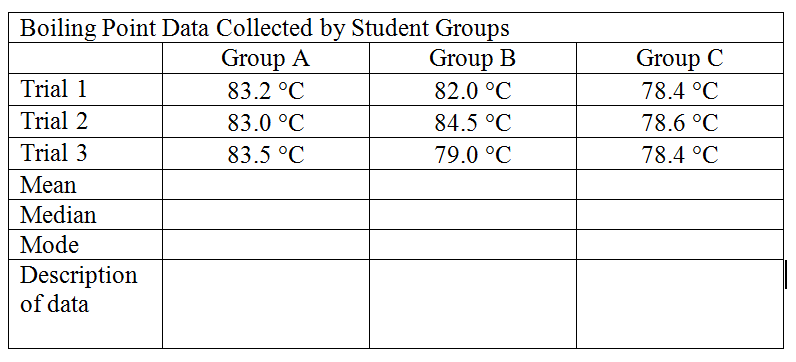
The table shows the data obtained by three groups when finding the boiling point of methanol. The accepted value is 
Neither precise nor accurate
Precise and accurate
Precise but not accurate
Accurate but not precise
Precise but not accurate
Group A's values are precise because the data values are all close to each other, but it is not accurate because it none of them is near the accepted value.
Example Question #11 : Calculations
The table shows the data obtained by three groups when attempting to find the boiling point of methanol. The accepted value is 
Precise but not accurate
Neither precise nor accurate
Precise and accurate
Accurate but not precise
Precise and accurate
Group C is precise because all of their values are close to one another. Their data is also accurate because their values are all near the accepted value. Therefore group C is both accurate and precise.
Example Question #14 : Calculations
Find the volume that 


Remember:

Rearrange the equation to solve for volume:

Plug in the values given in the problem:
} = 21.0857 mL")
However, we must take into account significant figures. Because both our given values have 3 significant figures, our answer must have 3 significant figures.
Therefore after rounding the correct answer is:

Example Question #15 : Calculations
A student experimentally determines the specific heat of water to be 


The formula for percent error is:
} * 100")
Plug in the given values and solve:
} * 100 = 1.67\%")
Therefore, after accounting for significant figures the correct answer is

Example Question #13 : Laboratory Techniques And Analysis
Place the following metric prefixes in order from smallest to largest:
k, M, m, n
n, m, k, M
n, M, k, m
m, n, k, M
n, k, M, m
n, m, k, M
Remember the saying "King Henry Died by Drinking Chocolate Milk". This is referencing the order of metric prefixes: kilo, hecto, deca, deci, centi, milli. Or in their abbreviations: k, h, da, d, c, m.
You also need to know nano (n) which is 
The final one you need to know for this question is Mega (M) which is 
Therefore the correct answer is: n, m, k, M (nano, milli, kilo, Mega).
Example Question #1 : Interpreting Graphs And Tables
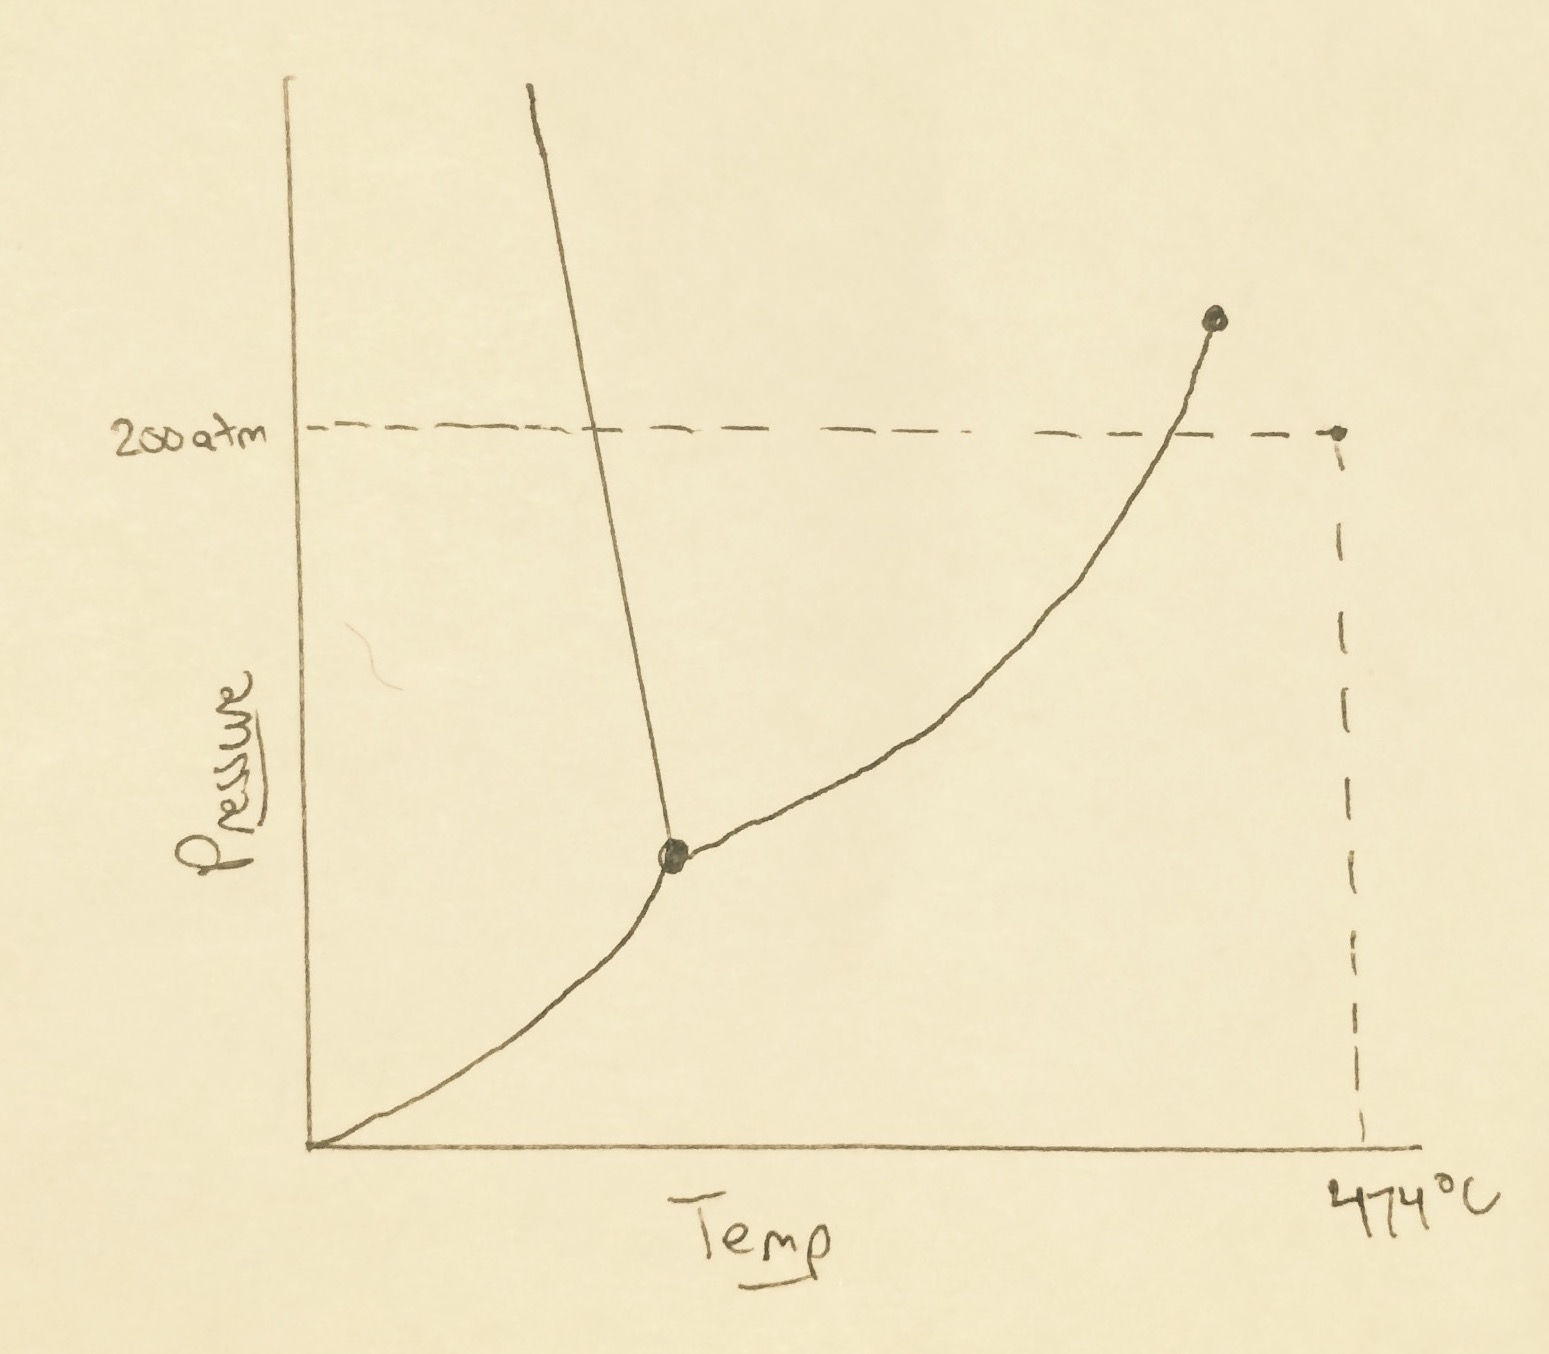
If a solution of water has a pressure of 200atm and a temperature of 474 degrees Celsius, what changes could be made to bring the sample to its critical point?
The critical point cannot be reached from these starting conditions
Decrease the pressure and increase the temperature
Decrease the pressure and decrease the temperature
Increase the pressure and decrease the temperature
Increase the pressure and increase the temperature
Increase the pressure and decrease the temperature
The critical point for water is at 218atm and 374 degrees Celcius, but on this graph it can be found at the end of the line between the gas and liquid portions of the water phase graph (you can see it end with a dot). This means we need to increase our pressure and decrease our temperature in order to reach the critical point from our initial conditions.
Example Question #191 : Ap Chemistry
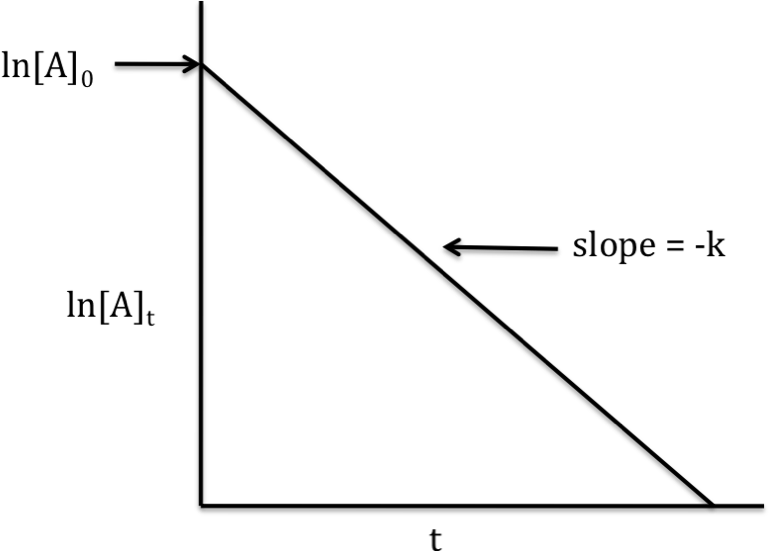
A chemistry student is trying to identify the reaction order for a reaction based on her interpretation of the above graph. The student identifies the reaction as a first-order reaction. Is this student correct in their conclusion? Why?
Yes. Regardless of the order of the reaction, a graph of the natural logarithm of the concentration of a reactant versus time will always yield a straight line with a negative slope.
Additional information is necessary in order to determine whether the graph corresponds to a first-order reaction.
No. A graph of the natural logarithm of the concentration of a reactant versus time yields a straight line with a negative slope for a zeroth-order reaction.
No. A graph of the natural logarithm of the concentration of a reactant versus time yields a straight line with a negative slope for a second-order reaction.
Yes. A graph of the natural logarithm of the concentration of a reactant versus time yields a straight line with a negative slope for a first-order reaction.
Yes. A graph of the natural logarithm of the concentration of a reactant versus time yields a straight line with a negative slope for a first-order reaction.
A first-order reaction can be expressed in different ways. One way is the following:

where:


By taking the natural logarithm of both sides, we can obtain an alternative form of the equation, expressed as:

This second equation is useful for graphing, because it fits the general equation of 


In the case of a zeroth-order reaction, the equation is:

Therefore, for a zeroth-order reaction, a straight line with a negative slope will only result from a graph of the concentration of a reactant versus time.
And lastly, in the case of a second-order reaction, the equation is:

Hence, a graph of the inverse concentration of a reactant versus time will yield a straight line with a positive slope, and this is indicative of a second-order reaction.
Example Question #191 : Ap Chemistry
How many significant figures should the answer to this calculation contain?


The number of significant figures in the final answer will ultimately be determined by the term in the equation that has the fewest significant figures. Let us examine the components of the expression we are given.


Since the least precise term in the expression has only one significant figure, our final answer will have only one significant figure.
Example Question #2 : Significant Figures
Using a graduated cylinder, you measure out 11 mL of water. You then go to an analytical balance and find the water to weigh 11.9273g.
What is the measured density of the water to the correct number of significant figures?


When dividing two numbers, the answer can only have as many significant figures as the number with the fewest significant figures. The mass has 6 significant figures while the volume only has 2, therefore the answer can only have 2. Don't forget to round!


Certified Tutor


All AP Chemistry Resources

