Algebra II : Using Probability to Make Decisions
Study concepts, example questions & explanations for Algebra II


All Algebra II Resources
Example Questions
Example Question #1 : Using Probability To Make Decisions
Raffle A, with payoff of -$13.57
Raffle A, with payoff of -$15.90
Raffle B, with payoff of -$15.90
Raffle B, with payoff of -$13.57
Raffle A, with payoff of -$13.57
") for each value k that X can take. Then sum these terms.
for each value k that X can take. Then sum these terms. =0\cdot .987=0")
=110\cdot .013=1.43")
=0+1.43=1.43")

") for each value k that Y can take. Then sum these terms.
for each value k that Y can take. Then sum these terms. =0\cdot .99=0")
=410\cdot .01=4.10")

Example Question #2 : Using Probability To Make Decisions
Raffle A, with payoff of -$14.50
Raffle B, with payoff of -$14.50
Raffle B, with payoff of -$17.55
Raffle A, with payoff of -$17.55
Raffle A, with payoff of -$14.50
for each value k that X can take. Then sum these terms. =0\cdot .99=0")
=250\cdot .01=2.50")
=0+2.50=2.50")
 for each value k that Y can take. Then sum these terms.
 =0\cdot .995=0")
=290\cdot .005=1.45")

Example Question #3 : Using Probability To Make Decisions
Raffle B, with payoff of -$16.95
Raffle A, with payoff of -$16.95
Raffle B, with payoff of -$15.90
Raffle A, with payoff of -$15.90
Raffle A, with payoff of -$15.90
for each value k that X can take. Then sum these terms. =110\cdot .01=1.10")
=0+1.10=1.10")
 for each value k that Y can take. Then sum these terms.
 =410\cdot .005=2.05")

Example Question #4 : Using Probability To Make Decisions
A spectator at a horse race is deciding which of three high-performing horses to bet on. Each horse’s ranks in past races can be expressed in terms of the following probability distributions:
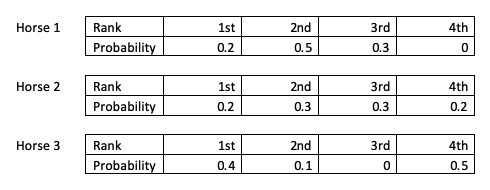
The spectator wants to bet on the horse with the highest expected rank in its next race. Assuming that past performance is a good predictor of each horse’s performance in its respective next races, which horse should the spectator bet on?
Horse 3
Horse 1
Horse 2
Horse 1
The expected value of each horse’s rank can be calculated as follows:
Expected value:
)+(2*p(2))+(3*p(3))+(4*p(4))=EV")
Horse 1:
+(2*0.5)+(3*0.3)+(4*0)=2.1")
Horse 2:
+(2*0.3)+(3*0.3)+(4*0.2)=2.5")
Horse 3:
+(2*0.1)+(3*0)+(4*0.5)=2.6")
The expected value predicts each horse’s rank in the upcoming race. Horse 1’s probability distribution yields the lowest expected value (i.e., the closest value to first place, represented by 1), so Horse 1 can be expected to rank most highly.
Example Question #1 : Using Probability To Make Decisions
A spectator at a horse race is deciding which of three high-performing horses to bet on. Each horse’s ranks in past races can be expressed in terms of the following probability distributions:
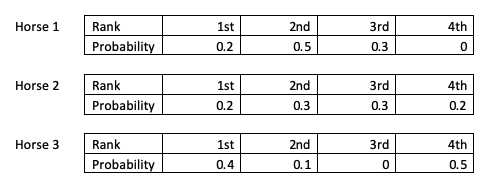
After some calculation, the spectator identifies and bets on the horse with the highest expected rank in its next race. However, her chosen horse places last in its next race, the other two horses each place first in their next races, and the spectator loses her bet. Why did her strategy fail?
Chance
There's not enough information to answer this question
Probability was not calculated correctly
Chance
Expected value identifies the most likely outcome, but other outcomes may still result, including unlikely outcomes. Although the horse the spectator bet on had the highest likelihood among the other horses of ranking well in its next race, the race was still ultimately subject to chance. Additionally, the three horses’ expected ranks differed only slightly--2.1, 2.5 and 2.6--meaning that the horse with the highest expected rank had only a slightly greater likelihood of performing more highly than the other two horses to begin with. As a result, chance was a relatively significant determinant of outcomes.
Example Question #2 : Using Probability To Make Decisions
Three students are playing a game with a fair six-sided die. If an even number is rolled, student A gets a point. If a number less than 4 is rolled, student B gets a point. If a prime number is rolled, student C gets a point. The die will be rolled fifteen times.
Is the game fair? In other words, do all three students have the same odds of getting a point?
No
Yes
Yes
The sample space for the die roll is {1, 2, 3, 4, 5, 6}. Student A gets a point if 2, 4 or 6 is rolled. Student B gets a point if 1, 2 or 3 is rolled. Student C gets a point if 2, 3 or 5 is rolled. Therefore, all three students have a 3/6 = ½ = 0/5 = 50% chance of getting a point on each die roll. The number of times the die is rolled does not affect each student’s probability of getting a point; the probability is the same in each roll so long as neither the die nor the point rules change.
Example Question #2 : Using Probability To Make Decisions
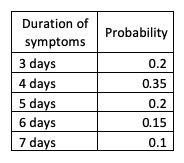
An experimental drug is created to reduce the amount of time patients feel sick with the common cold. In clinical trials of people suffering from the common cold, different participants taking the drug experienced symptoms for varying lengths of time. The scientists running the trial rounded each participant’s duration of symptoms to the nearest day, and used this information to develop the following probability distribution:
There were 


If the probability distribution was constructed based on the real durations of participants’ symptoms, the 


Example Question #8 : Using Probability To Make Decisions
An experimental drug is created to reduce the amount of time patients feel sick with the common cold. In clinical trials of people suffering from the common cold, different participants taking the drug experienced symptoms for varying lengths of time. The scientists running the trial rounded each participant’s duration of symptoms to the nearest day, and used this information to develop the following probability distribution:
If the scientists select one of the participants at random, what duration of symptoms can they expect the participant to have experienced?


The expected duration of a randomly selected patient’s symptoms can be calculated using the expected value yielded by this probability distribution. This expected value can be calculated as follows:
Expected value:
)+(4*p(4))+(5*p(5))+(6*p(6))+(7*p(7))=EV")
+(4*0.35)+(5*0.2)+(6*0.15)+(7*0.1)=4.6")
Therefore, the most likely duration of symptoms a randomly selected participant would have is 
Example Question #5171 : Algebra Ii
A fair coin is flipped 9 times, yielding the following results:
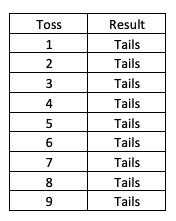
Two students are deciding whether to flip this coin a tenth time, in order to decide which one of them will get to keep the five-dollar bill they found on a sidewalk. Would this be a fair method for making this decision?
Cannot be determined
Yes
No
Yes
As long as the coin is truly fair, meaning that there is a 50% chance that it will land on heads and a 50% chance that it will land on tails, the coin will still be fair on the tenth flip. Past results do not affect the odds of a particular result on a subsequent identical event. Therefore, flipping this coin would be a fair way to decide which of the two students will get to keep the five-dollar bill, since each one of them would have a 50% probability of keeping the bill.
Example Question #5171 : Algebra Ii
Ann, Bob and Cathy are students working together on a group project for school. The project involves three tasks, each of which one of the three students will complete: creating a model, interviewing a local expert, and writing a report. No student has the time to complete more than one task, and all three of them have a strong preference for interviewing the local expert. They decide to find a fair way to randomly distribute the three tasks among themselves.
Which of the following would be a fair method of accomplishing this, allowing all three of them equal odds of completing their preferred task?
The local expert chooses one of the three students.
The three tasks are numbered, and the three resulting numbers are written on separate identical pieces of paper and put into a box. Each student takes turns drawing a piece of paper without looking and is assigned the task corresponding to their number.
Ann selects from the three tasks. Bob then chooses which he would prefer, and the remaining task is assigned to Cathy.
Bob flips a coin. If it lands heads, he creates the model; if tails, he interviews a local expert. After he is assigned a task by this method, Cathy flips a coin. If it lands heads, she writes the report; if tails, she is assigned the other remaining task. Ann is then assigned whichever task is left.
The three tasks are numbered, and the three resulting numbers are written on separate identical pieces of paper and put into a box. Each student takes turns drawing a piece of paper without looking and is assigned the task corresponding to their number.
"Ann selects from the three tasks. Bob then chooses which he would prefer, and the remaining task is assigned to Cathy. " is incorrect because an intentional choice, particularly when biased by a strong preference for a single outcome, is unlikely to be random. Further, were Ann to choose to interview the expert, Bob and Cathy would never have a chance to be assigned that task, significantly advantaging one of the three students over the other two. "Bob flips a coin. If it lands heads, he creates the model; if tails, he interviews a local expert. After he is assigned a task by this method, Cathy flips a coin. If it lands heads, she writes the report; if tails, she is assigned the other remaining task. Ann is then assigned whichever task is left." is incorrect because Bob’s probability of interviewing the expert is 50% in this scenario, a higher probability than either Cathy or Ann would have. "The local expert chooses one of the three students." is incorrect because an intentional choice is unlikely to be random. "The three tasks are numbered, and the three resulting numbers are written on separate identical pieces of paper and put into a box. Each student takes turns drawing a piece of paper without looking and is assigned the task corresponding to their number. " is correct because any one of the three students may draw any one of the three slips, and cannot see which they are drawing, preventing their personal biases or preferences from influencing their selections.


All Algebra II Resources

