Algebra II : Linear Functions
Study concepts, example questions & explanations for Algebra II


All Algebra II Resources
Example Questions
Example Question #41 : Linear Functions
Which of the following equations passes through ")


Since the line goes through ")
")
Since we are looking for parallel lines, we need to write the equation of a line that has the same slope as the original, which is 
Slope-intercept form equation is 


Therefore,

Example Question #331 : Functions And Graphs
Write an equation of the line passing through ")
")
Reminder: Slope-Intercept form is 


Step 1: Find the Slope

Step 2: Find the y-intercept
Use the slope and a point in the original y-intercept

+b")

Step 3: Write your equation

Example Question #43 : Linear Functions
Find the slope-intercept form of an equation of the line that has a slope of 
")


Since we know the slope and we know a point on the line we can use those two piece of information to find the y-intercept.

+b")


Example Question #44 : Linear Functions
Determine the slope of a line that has points ")
")


Slope is the change of a line. To find this line one can remember it as rise over run. This rise over run is really the change in the y direction over the change in the x direction.
Therefore the formula for slope is as follows.

Plugging in our given points
=(-1,5)")
=(2,3)")

Example Question #11 : Graphing Linear Functions
What is the equation of the line passing through (-1,4) and (2,6)?


To find the equation of this line, first find the slope. Recall that slope is the change in y over the change in x: 
")
")

Example Question #6 : Graphing Functions
An individual's maximum heart rate can be found by subtracting his or her age from 


In 

We are looking for a graph with a slope of -1 and a y-intercept of 220.
The slope is -1 because as you grow one year older, your maximum heart rate decreases by 1.
Example Question #41 : Linear Functions
What is the slope of 


To solve this, first put the linear equation into slope-intercept form:

Recall that in slope intercept form

the m term is the slope value.
Therefore, the slope is 2.
Example Question #22 : Graphing Linear Functions
How many 
 = - x^{2} + 7x +11")
have?
Zero
Cannot be determined
One
Two
Four
Two
The graph of a quadratic function  = ax^{2}+ bx + c")

")
 = 0")

The number of 

(11)= 49 - (-44 ) = 93")
The discriminant is positive, so there are two real solutions to the quadratic equation, and the graph of the function has two
Example Question #42 : Linear Functions
Which of the following graphs correctly depicts the graph of the inequality 


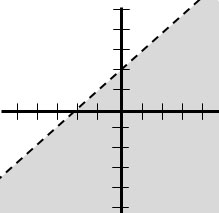
None of the graphs.
Let's start by looking at the given equation:

The inequality is written in slope-intercept form; therefore, the slope is equal to 

All of the graphs depict a line with slope of 

")


Because this statement is true, the origin must be included in the shaded region, so we shade below the line.
Finally, a statement that is "less than" or "greater than" requires a dashed line in the graph. On the other hand, those that are "greater than or equal to" or "less than or equal to" require a solid line. We will select the graph with shading below a dashed line.
Example Question #1 : Transformations Of Linear Functions
Write the equation from the augmented matrix.


Do the first row first and use x and y to represent your variable.


Certified Tutor


All Algebra II Resources

