Algebra II : Box and Whisker Plots
Study concepts, example questions & explanations for Algebra II


All Algebra II Resources
Example Questions
Example Question #1 : Box And Whisker Plots
Draw a Box and Whisker plot for the following data set.

Put the data in numerical order (from smallest to largest) if it isn't already. In order to find the median, divide the data into two halves. In order to divide the values into quartiles, find the median of the two halves.

1st quartile: 


Median of 1st quartile:

2nd quartile = Median of total set:

3rd quartile: 


Median of 3rd quartile:

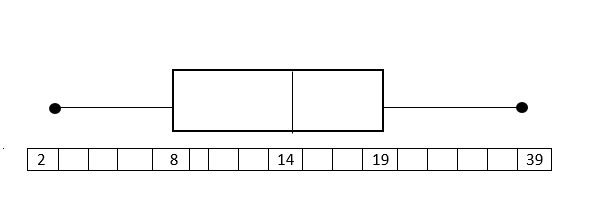
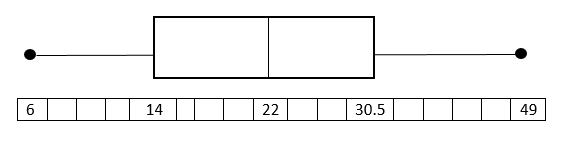
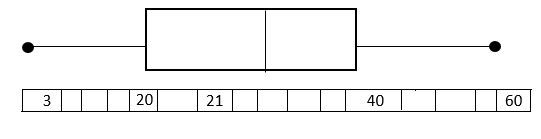
To construct the Box and Whisker Plot we use the minimum and the maximum value in the data set as the ends of the whiskers. To construct the box, we plot a line at the median of the 1st quartile, the median of our total data set, and at the median of the 3rd quartile. Then we connect the tops and bottom of the lines. The result is as follows:
The endpoints (black dots) represent the smallest and largest values, in this case, 2 and 39.
Example Question #1 : Box And Whisker Plots
Draw a Box and Whisker plot for the following data set.

Put the data in numerical order (from smallest to largest) if it isn't already. In order to find the median, divide the data into two halves. In order to divide the values into quartiles, find the median of the two halves.
1st quartile:

Median of 1st quartile:

2nd quartile = Median: 
3rd quartile:

Median of 3rd quartile: 
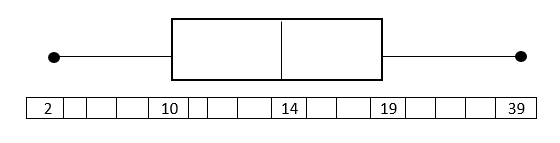
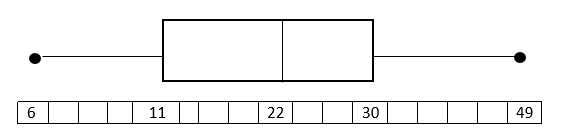
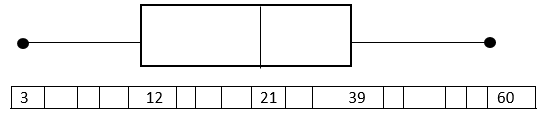
To construct the Box and Whisker Plot we use the minimum and the maximum value in the data set as the ends of the whiskers. To construct the box, we plot a line at the median of the 1st quartile, the median of our total data set, and at the median of the 3rd quartile. Then we connect the tops and bottom of the lines. The result is as follows:
Example Question #81 : Algebra Ii
Draw a box and whisker plot for the following data set.

Put the data in numerical order (from smallest to largest) if it isn't already. In order to find the median, divide the data into two halves. In order to divide the values into quartiles, find the median of the two halves.
1st quartile:

Median of 1st quartile:

2nd quartile = Median:

3rd quartile:

Median of 3rd quartile:

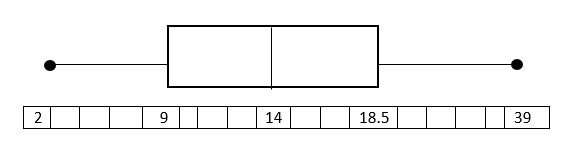
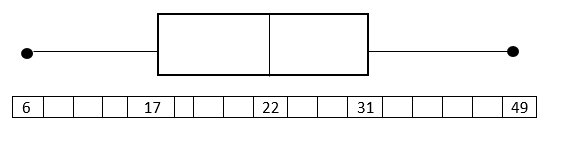
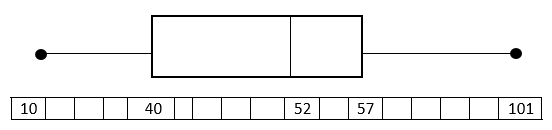
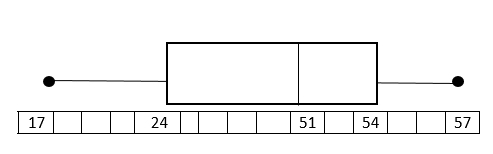
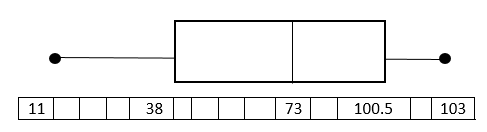
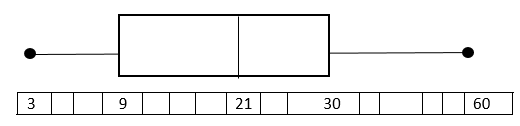
To construct the Box and Whisker Plot we use the minimum and the maximum value in the data set as the ends of the whiskers. To construct the box, we plot a line at the median of the 1st quartile, the median of our total data set, and at the median of the 3rd quartile. Then we connect the tops and bottom of the lines. The result is as follows:
Example Question #1 : Box And Whisker Plots
Draw a Box and Whisker plot for the following data set.

Put the data in numerical order (from smallest to largest) if it isn't already. In order to find the median, divide the data into two halves. In order to divide the values into quartiles, find the median of the two halves.
1st quartile:

Median of 1st quartile:

2nd quartile= Median:

3rd quartile:

Median of 3rd quartile:

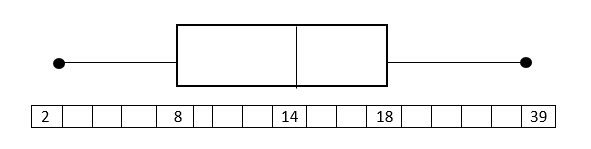
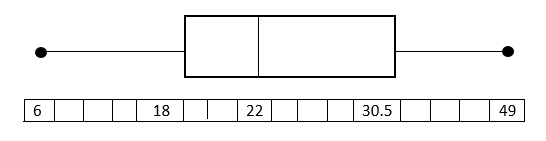
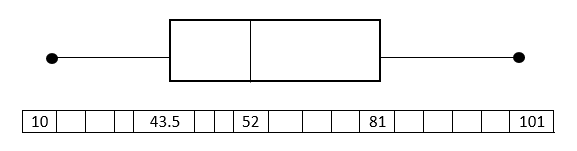
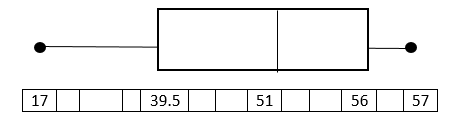
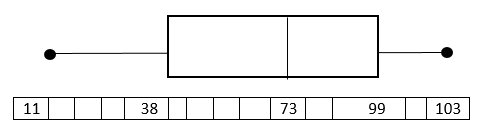
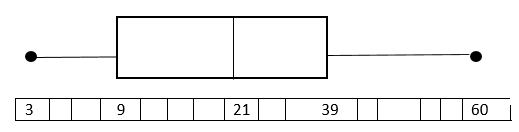
To construct the Box and Whisker Plot we use the minimum and the maximum value in the data set as the ends of the whiskers. To construct the box, we plot a line at the median of the 1st quartile, the median of our total data set, and at the median of the 3rd quartile. Then we connect the tops and bottom of the lines.
Example Question #2 : Box And Whisker Plots
Draw a Box and Whisker plot for the following data set.

Put the data in numerical order (from smallest to largest) if it isn't already. In order to find the median, divide the data into two halves. In order to divide the values into quartiles, find the median of the two halves.
1st quartile:

Median of 1st quartile:

2nd quartile = Median:

3rd quartile:

Median of 3rd quartile: 
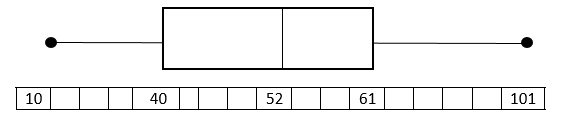
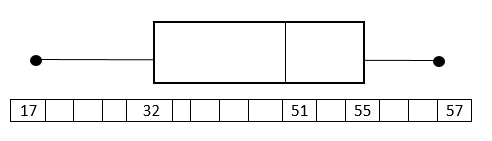
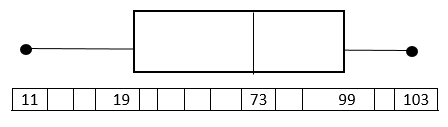
To construct the Box and Whisker Plot we use the minimum and the maximum value in the data set as the ends of the whiskers. To construct the box, we plot a line at the median of the 1st quartile, the median of our total data set, and at the median of the 3rd quartile. Then we connect the tops and bottom of the lines. The result is as follows:
Example Question #2 : Box And Whisker Plots
Draw a Box and Whisker plot for the following data set.

Put the data in numerical order (from smallest to largest) if it isn't already. In order to find the median, divide the data into two halves. In order to divide the values into quartiles, find the median of the two halves.
1st quartile:

Median of 1st quartile:

2nd quartile = Median:

3rd quartile:

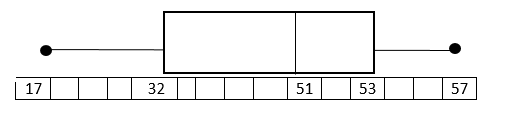
Median of 3rd quartile: 
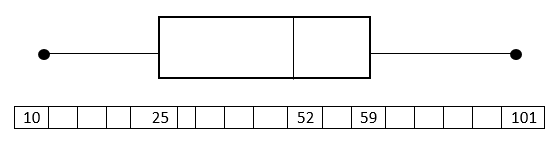
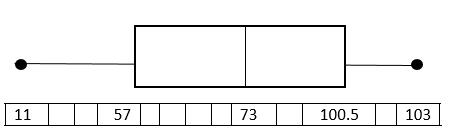
To construct the Box and Whisker Plot we use the minimum and the maximum value in the data set as the ends of the whiskers. To construct the box, we plot a line at the median of the 1st quartile, the median of our total data set, and at the median of the 3rd quartile. Then we connect the tops and bottom of the lines. The result is as follows:
Example Question #81 : Algebra Ii

The box and whisker plot above can be used to find all of the following information about the data set that it describes except:
The 4 quartiles of the data set
Median Value
Maximum and minimum values
The box and whisker plot gives you all of these.
Range
The box and whisker plot gives you all of these.
The median value of the data set, 86, is represented by the dashed line inside the box.
The maximum and minimum of the data set, 100 and 75 (respectively), are found at the far ends of the 2 whiskers on either end.
The range of the data set is found by subtracting the minimum from the maximum; 100-75=25, so the range is 25.
The upper and lower quartiles are given by the two boundaries between the box and the whiskers: the lower quartile (1st quartile) is the left boundary, 80 in the data set; the upper quartile (3rd quartile) is the right boundary, which is 92 in the data set.
All of the other choices are provided by the box and whisker plot, so the correct choice is "The box and whisker plot gives you all of these"


All Algebra II Resources

