Algebra 1 : Linear Inequalities
Study concepts, example questions & explanations for Algebra 1


All Algebra 1 Resources
Example Questions
Example Question #71 : Linear Inequalities

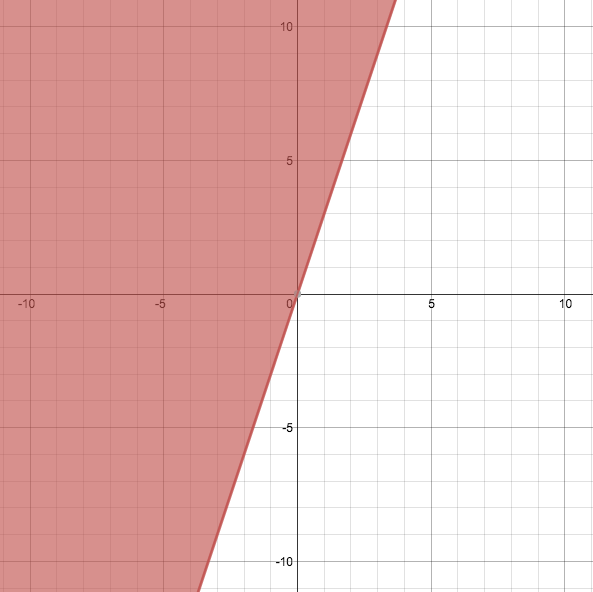
The above graph depicts which of the following equations or inequalities?


Given the above graph, we can initially deduce that 


We can use a test point to determine which of the remaining inequalities is the correct answer. The test point can be any point that is not on the line, so let's select ")
")


")

Example Question #11 : Graphing Inequalities
The above graph depicts which of the following equations or inequalities?


Given the above graph, we can initially deduce that 


We can use a test point to determine which of the remaining inequalities is the correct answer. The test point can be any point that is not on the line, so let's select ")
")


")

Example Question #12 : Graphing Inequalities
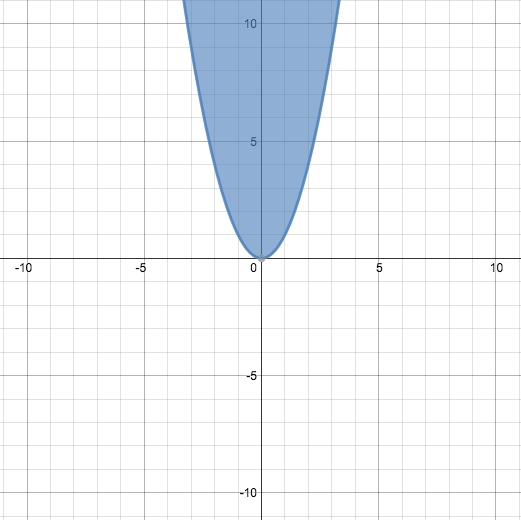
The above graph depicts which of the following equations or inequalities?


Given the above graph, we can initially deduce that 


We can use a test point to determine which of the remaining inequalities is the correct answer. The test point can be any point that is not on the line, so let's select ")
")


")

Example Question #13 : Graphing Inequalities
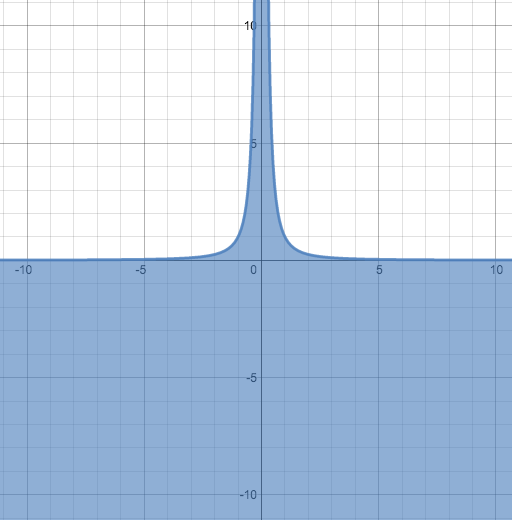
The above graph depicts which of the following equations or inequalities?


Given the above graph, we can initially deduce that 


We can use a test point to determine which of the remaining inequalities is the correct answer. The test point can be any point that is not on the line, so let's select ")
")


")

Example Question #14 : Graphing Inequalities
The above graph depicts which of the following equations or inequalities?


Given the above graph, we can initially deduce that 


We can use a test point to determine which of the remaining inequalities is the correct answer. The test point can be any point that is not on the line, so let's select ")
")


")

Example Question #11 : Graphing Inequalities
What is the equation of the graph of the inequality shown below?
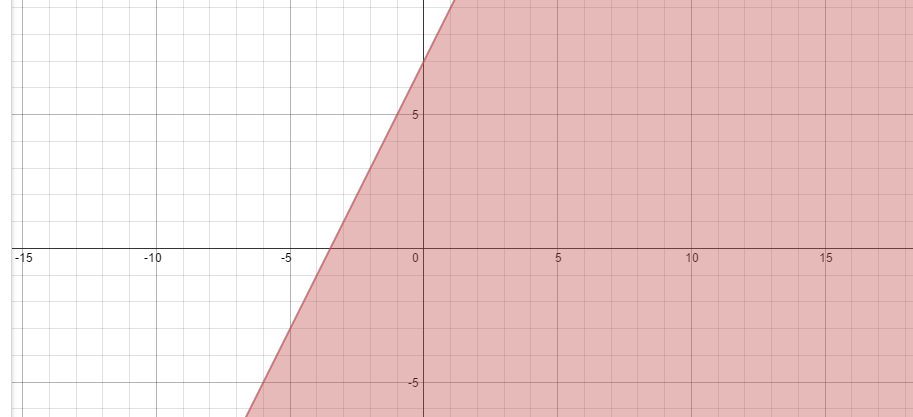


Because the line is a solid line and is shaded down you know that the equation is less than or equal to some function.
When finding slope, you must find the rise over the run which is 2. The function also has a y-intercept of 7,
So your end result of your equation is:

Example Question #11 : Graphing Inequalities
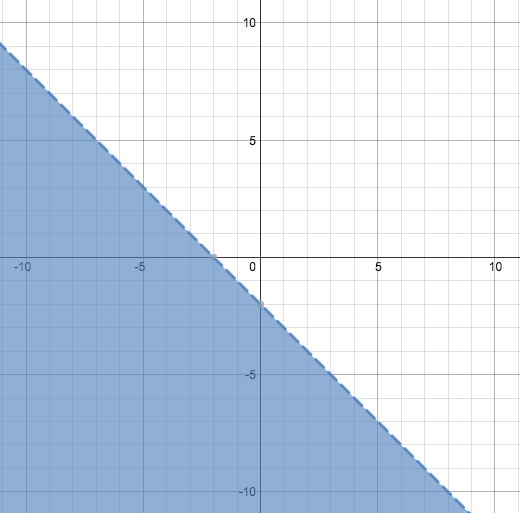
Which of the following graphs correctly depicts the graph of the inequality 


None of the graphs.
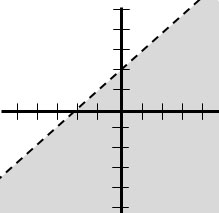

Let's start by looking at the given equation:

The inequality is written in slope-intercept form; therefore, the slope is equal to 

All of the graphs depict a line with slope of 

")


Because this statement is true, the origin must be included in the shaded region, so we shade below the line.
Finally, a statement that is "less than" or "greater than" requires a dashed line in the graph. On the other hand, those that are "greater than or equal to" or "less than or equal to" require a solid line. We will select the graph with shading below a dashed line.
Example Question #1 : Absolute Value Inequalities
Solve for 

")
")
The inequality has no solution.
")
")
The inequality has no solution.
The absolute value of a number must always be nonnegative, so 

Example Question #2 : Absolute Value Inequalities
Solve the inequality 


First, we can simplify this inequality by subtracting 7 from both sides. This gives us

Next, however, we need to make two separate inequalities due to the presence of an absolute value expression. What this inequality actually means is that

and

(Be careful with the inequality signs here! The second sign must be switched to allow for the effect of absolute value on negative numbers. In other words, the inequality must be greater than 

and

For the original statement to be true, both of these inequalities must be fulfilled. We're left with a final answer of

Example Question #1 : Absolute Value
Solve the inequality:

")

 \cup \left (\frac{27}{5} , \infty \right )")
")
The inequality compares an absolute value function with a negative integer. Since the absolute value of any real number is greater than or equal to 0, it can never be less than a negative number. Therefore, 

Certified Tutor

Certified Tutor

All Algebra 1 Resources

