All Algebra 1 Resources
Example Questions
Example Question #2 : Parabolic Functions
What is the minimum possible value of the expression below?
The expression has no minimum value.
We can determine the lowest possible value of the expression by finding the 

The vertex of the parabola 

The parabola is concave upward (its quadratic coefficient is positive), so 

Example Question #422 : Functions And Graphs
What is the vertex of the function 


The equation of a parabola can be written in vertex form: 
The point 


In this example, 
Example Question #2 : Graphing Polynomial Functions
Which of the graphs best represents the following function?


None of these

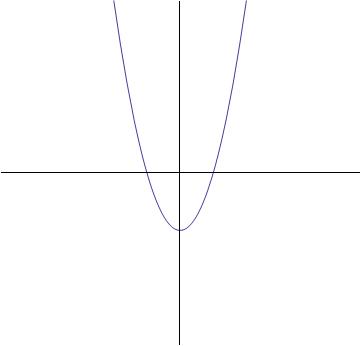
The highest exponent of the variable term is two (
The graph below will be the answer, as it shows a parabolic curve.

Example Question #4 : Parabolic Functions
What is the equation of a parabola with vertex 


From the vertex, we know that the equation of the parabola will take the form 

To calculate that 


Now the equation is 
Expand the squared term:
Distribute the fraction through the parentheses:
Combine like terms:
Example Question #3 : Graphing Polynomial Functions


None of the above

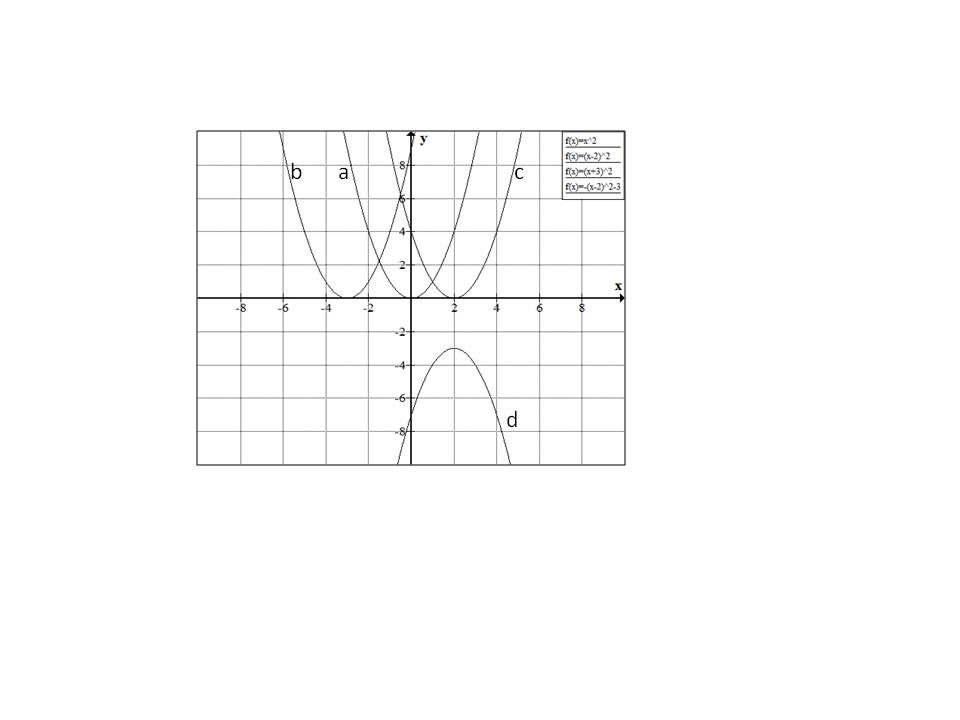
Starting with


Similarly 

Hence the correct answer is option 
Example Question #423 : Functions And Graphs
Which of the following graphs matches the function 


Start by visualizing the graph associated with the function :

Terms within the parentheses associated with the squared x-variable will shift the parabola horizontally, while terms outside of the parentheses will shift the parabola vertically. In the provided equation, 2 is located outside of the parentheses and is subtracted from the terms located within the parentheses; therefore, the parabola in the graph will shift down by 2 units. A simplified graph of looks like this:

Remember that there is also a term within the parentheses. Within the parentheses, 1 is subtracted from the x-variable; thus, the parabola in the graph will shift to the right by 1 unit. As a result, the following graph matches the given function :

All Algebra 1 Resources


