ACT Science : How to find experimental design in chemistry
Study concepts, example questions & explanations for ACT Science


All ACT Science Resources
Example Questions
Example Question #31 : How To Find Experimental Design In Chemistry
Clock reactions are chemical interactions that exhibit a physical change periodically over a given time interval. Many of these reactions involve iodine, the most famous being the Chlorine Dioxide-Iodine-Malonic Acid reaction. These reactions can be quite startling as flasks of colorless liquid periodically turn dark blue and then resolve back to their original colorless state. Even more striking, they seem to alternate between being colorless and blue several times. The term "clock reaction" is derived from the fact that the time at which these sudden changes occur can be predicted.
Beyond performing these reactions in a well stirred beaker, there are two other notable ways to conduct experiments with clock reactions that demonstrate interesting properties of these reactions. The first is in a continuous flow stirred tank reactor (CSTR). In a CSTR, the reactants are introduced at a continuous rate while the volume of liquid in the reactor is kept constant by siphoning off excess fluid. The result of this process is that one can maintain the ideal conditions in which the reaction may occur over time and restricts the buildup of excess product or reactant that would otherwise make the oscillations of the reactions decay. In a CSTR, clock reactions can be maintained switching predictably from colorless to blue, for example, for far longer than in a simple beaker.
The second way to conduct a clock reaction experiment is in a tank with no stirring at all. This allows the reactants to interact heterogeneously, or without being thoroughly mixed. When this occurs, we can get some parts of the tank that are one color and other parts that are another color. This means that we can observe two different stages of the reaction in one vessel. The patterns that this makes are called Turing patterns, named by the great computer scientist Alan Turing. Turing predicted that the heterogeneous mixing of chemicals called morphogens in complex organisms were responsible for biological pattern formation like spots on a leopard, stripes on a zebra, or patterns on a tropical fish. The existence of such patterns and chemicals has since been confirmed and clock reactions are often used to study these types of Turing patterns.
Suppose after reading this passage you wanted to design an experiment to study closely the exact moment of physical change in the reaction. Which method described in the passage would you employ?
An unstirred tank
The continuous flow stirred reactor
The stirred beaker
A mass spectrometer
A flow cytometer
The continuous flow stirred reactor
If you wanted to study the exact moment of change, you want to observe this change as many times as you can to collect information. While a stirred beaker is a decent choice, the best choice would be the CSTR or continuous flow stirred reactor because it can keep the reaction running optimally for longer periods of time. This would allow you to collect a greater quantity of data with more accuracy.
Example Question #32 : How To Find Experimental Design In Chemistry
Clock reactions are chemical interactions that exhibit a physical change periodically over a given time interval. Many of these reactions involve iodine, the most famous being the Chlorine Dioxide-Iodine-Malonic Acid reaction. These reactions can be quite startling as flasks of colorless liquid periodically turn dark blue and then resolve back to their original colorless state. Even more striking, they seem to alternate between being colorless and blue several times. The term "clock reaction" is derived from the fact that the time at which these sudden changes occur can be predicted.
Beyond performing these reactions in a well stirred beaker, there are two other notable ways to conduct experiments with clock reactions that demonstrate interesting properties of these reactions. The first is in a continuous flow stirred tank reactor (CSTR). In a CSTR, the reactants are introduced at a continuous rate while the volume of liquid in the reactor is kept constant by siphoning off excess fluid. The result of this process is that one can maintain the ideal conditions in which the reaction may occur over time and restricts the buildup of excess product or reactant that would otherwise make the oscillations of the reactions decay. In a CSTR, clock reactions can be maintained switching predictably from colorless to blue, for example, for far longer than in a simple beaker.
The second way to conduct a clock reaction experiment is in a tank with no stirring at all. This allows the reactants to interact heterogeneously, or without being thoroughly mixed. When this occurs, we can get some parts of the tank that are one color and other parts that are another color. This means that we can observe two different stages of the reaction in one vessel. The patterns that this makes are called Turing patterns, named by the great computer scientist Alan Turing. Turing predicted that the heterogeneous mixing of chemicals called morphogens in complex organisms were responsible for biological pattern formation like spots on a leopard, stripes on a zebra, or patterns on a tropical fish. The existence of such patterns and chemicals has since been confirmed and clock reactions are often used to study these types of Turing patterns.
Given that different patterns happen when different concentrations of the reactants interact with each other, which of the following would NOT be a useful experimental variable in an experiment designed to explore the mechanism and dynamics of different patterns of chemicals in clock reactions?
Time
The initial concentration of reactants
The size of the reaction tank
The depth of the tank
The volume of water in the tank before adding reactants
Time
Since concentration is important to the pattern formation and the reactions happen over and over again in time, it seems that any answer that involves changing either the concentration of reactants directly or indirectly (via the volume of the reaction vessel into which the reactants are placed) is a valid experimental variable. The answer that would not be the most helpful is time because we know these reactions proceed over and over again in time.
Example Question #31 : How To Find Experimental Design In Chemistry
A student performed the following procedures to study various photosynthetic pigments (light-absorbing chemicals) in tree leaves and the wavelengths of light they absorb.
Experiment 1:
The student obtained samples of leaves from oaks, maples, ashes, sycamores, and poplars. Each leaf sample was ground separately with a mortar and pestle to release the pigments, and then each sample was suspended in water to make a colored solution of the pigment. The student then measured the absorption spectrum (a graph of how much light is absorbed by a pigment at varying wavelengths of light) of each solution in a device called a spectrophotometer. The setup of a spectrophotometer is shown below in Diagram 1.
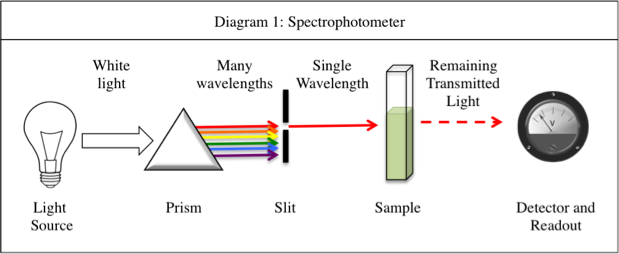
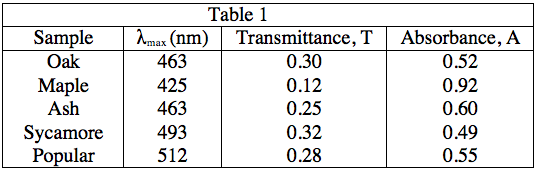
The light source emits white light, which is split into its various wavelengths by the prism. Next, a slit, which can be moved up or down to select a particular wavelength, is used to transmit just a single wavelength to the sample. The sample absorbs a fraction of this light that is characteristic to the pigment in the sample, and the rest is transmitted to the detector for a readout. Using the spectrophotometer, the student found the λmax (the wavelength of light in nanometers (nm) that the pigment absorbs most intensely, for each sample) and recorded the results in Table 1. Table 1 also shows the transmittance and absorbance values at λmax. Transmittance, T, is defined as the fraction of light, expressed as a decimal, which passes through the sample. Absorbance, A, is given by:
A = –log(T) or 10–A = T
Experiment 2:
A student is given a leaf from an unknown source. She crushes and extracts the pigment according to the procedure in Experiment 1. Measuring the absorbance spectrum in the spectrophotometer produces the following readout, shown in Diagram 2.
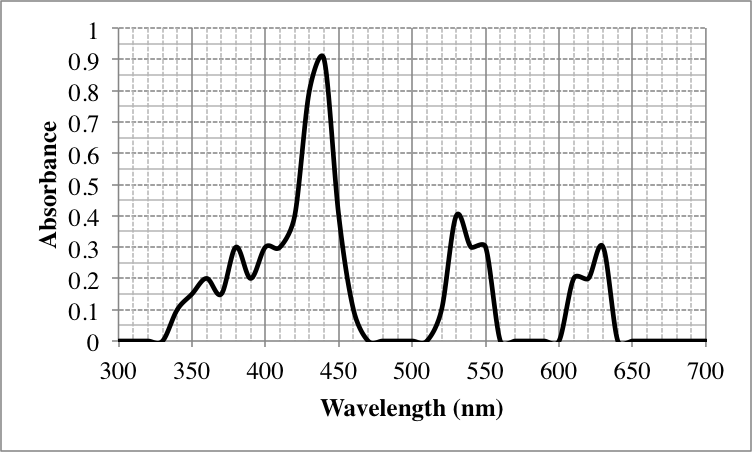
Diagram 2
During the experiment, the student finds the mechanism that moves the slit up and down has stopped functioning. Which of the following will result from this problem?
The student will no longer be able to find the absorbance at a particular wavelength.
The student will no longer be able to study the results at various wavelengths of light.
The student will no longer be able to find the transmittance at a particular wavelength.
The student will no longer be able to split the white light from the light source into a spectrum of wavelengths.
The student will no longer be able to study the results at various wavelengths of light.
The description of the spectrophotometer in Experiment 1 states that the purpose of the slit is to be able to select a single wavelength of light. This wavelength can be chosen by moving the slit up or down. Thus, if it cannot move up or down, it can only select the wavelength of light it is stuck on, and can no longer scan different wavelengths of light to pass through the sample.
Finding the transmittance is governed by the function of the detector, finding the absorbance is governed by a mathematical transformation of the transmittance value as shown by the equation in Experiment 1, and the splitting of white light into various wavelengths is governed by the function of the prism. Thus, the three other answers are incorrect.
Example Question #91 : Chemistry
A student wanted to study the kinetics, or rates of a chemical reaction based on the concentrations of its reactants and products, of the reaction shown below.
}+2KMnO_4_{(aq)}+3H_2SO_4_{(aq)}\rightarrow")
}+2MnSO_4_{(aq)}+K_2SO_4_{(aq)}+8H_2O_{(l)}")
This reaction is easy to monitor using a spectrophotometer, which measures how much light of a particular wavelength is absorbed by a solution. The deep purple potassium permanganate, or 

Experiment 1:
The student constructed a standard curve, or a graph of the absorbance of solutions of varying concentrations of potassium permanganate, to quantify the relationship between concentration and absorbance. To prepare five sample of increasing concentration, he labeled five test tubes A, B, C, D, and E, weighed out 0.1, 0.2, 0.3, 0.4, and 0.5 grams of potassium permanganate into each, respectively, and added 1 milliliter (mL) of water to each test tube to dissolve. Then, he used the spectrophotometer to determine the absorbance at 550 nm of each sample. The data is graphed in Figure 1 below.
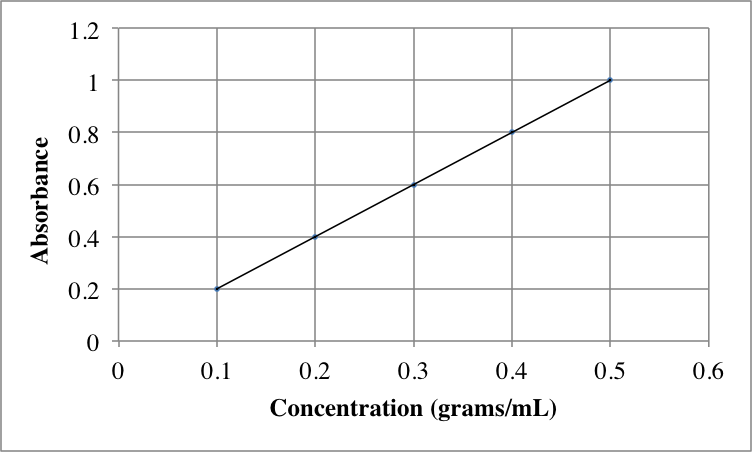
Figure 1
Experiment 2:
The student then studied potassium permanganate in the presence of oxalic acid, 
A scientific relationship, known as Beer's Law, mathematically correlates absorbance to concentration via the following equation:

where 


You can solve for 


 = E(0.1)")
By dividing, we can see that 
Alternatively, you may view the equation 


Example Question #35 : How To Find Experimental Design In Chemistry
A student wanted to study the kinetics, or rates of a chemical reaction based on the concentrations of its reactants and products, of the reaction shown below.
This reaction is easy to monitor using a spectrophotometer, which measures how much light of a particular wavelength is absorbed by a solution. The deep purple potassium permanganate, or
Experiment 1:
The student constructed a standard curve, or a graph of the absorbance of solutions of varying concentrations of potassium permanganate, to quantify the relationship between concentration and absorbance. To prepare five sample of increasing concentration, he labeled five test tubes A, B, C, D, and E, weighed out 0.1, 0.2, 0.3, 0.4, and 0.5 grams of potassium permanganate into each, respectively, and added 1 milliliter (mL) of water to each test tube to dissolve. Then, he used the spectrophotometer to determine the absorbance at 550 nm of each sample. The data is graphed in Figure 1 below.
Figure 1
Experiment 2:
The student then studied potassium permanganate in the presence of oxalic acid, 
The "special setting" on the spectrophotometer underlined in the description of Experiment 2 likely involves what?
Measuring how fast the concentration of oxalic acid decreases by observing its changing absorbance at 550 nm.
Measuring concentrations of potassium permanganate and oxalic acid by observing their relative absorbances at 550nm and 500 nm, respectively.
Measuring how fast the concentration of potassium sulfate increases by observing its changing absorbance at 500 nm.
Measuring concentrations of potassium permanganate and manganese sulfate by observing their relative absorbances at 550nm and 500 nm, respectively.
Measuring concentrations of potassium permanganate and manganese sulfate by observing their relative absorbances at 550nm and 500 nm, respectively.
"Measuring concentrations of potassium permanganate and manganese sulfate by observing their relative absorbances at 550 nm and 500 nm, respectively" is the correct answer. It is the only answer that contains chemicals that absorb visible light, and thus the only concentrations that may be monitored by the spectrophotometer, as stated in the introduction to the experiments.


All ACT Science Resources

