ACT Science : How to find data representation in biology
Study concepts, example questions & explanations for ACT Science


All ACT Science Resources
Example Questions
Example Question #121 : Act Science
Botulism is a rare disease caused by the botulinum toxin produced and secreted by Clostridium botulinum. Botulism causes muscle weakness and in severe cases can inhibit the muscles of respiration and lead to respiratory failure and even death. The exotoxin produced by Clostridium botulinum causes damage to its host by inhibiting of the release of the chemical messenger acetylcholine. Acetylcholine is a neurotransmitter, meaning it is responsible for enabling communication between a nerve cell and other cells.
Experiment A
Scientists conducting a study on the lethality of the botulinum toxin are looking at the effect of acidification on the toxin’s potency. They design a study in mice to identify the minimal lethal dose of botulinum toxin. The scientists believe acidification will reduce the minimal lethal dose. The findings from their study are below:

Experiment B
Scientists also assessed the relationship between acidification and the incubation period. The incubation period was defined as the time between exposure to the toxin and the onset of symptoms.

Data and concepts from: Bronfenbrenner, J. & Schlesinger M.J. (1922). Some of the factors contributing to toxicity of botulinus toxin by mouth. JAMA, 78(20), 1519-1521.
If a minimal lethal dose was 
8.0
10.0
7.0
14.0
10.0
A minimal lethal dose of 

Example Question #122 : Act Science
The cells of multicellular organisms must be linked to each other through special structures called cellular junctions. A gap junction is a type of cellular junction, which allows for the passage of small molecules for fast coordination between cells. For example, cardiac cells in the heart and neurons in the brain rely on gap junctions. However, gap junctions are small and there is a limit to how large a molecule can be in order for it to pass through the gap junction.
An experiment is designed to see how large molecules can be to pass through a gap junction. A single layer of cells is grown in a petri dish. A single cell is then injected with a dye labeled with a fluorescent molecule. Researchers observe the following:
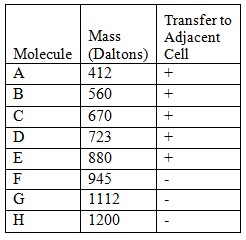
Based on the experiment’s data, which of the following is the best conclusion?
Molecules 412 Daltons or greater in size pass through gap junctions.
Molecules greater than 1200 Daltons do not pass through gap junctions.
Molecules 945 Daltons or greater in size do not pass through gap junctions.
Molecules less than 880 Daltons do not pass through gap junctions.
Molecules 945 Daltons or greater in size do not pass through gap junctions.
The best answer is "Molecules 945 Daltons or greater in size do not pass through gap junctions." This is because we do not know about molecules between 880 and 945 Daltons. Also while parts of the other statements may be true but they are not the best description of the data's findings.
Example Question #123 : Act Science
Poisons dart frogs earned their name because of a deadly neurotoxin they produce and secrete. To synthesize this neurotoxin, the frogs must consume termites which contain the necessary precursors that the frog processes into their poison. Frogs consuming more of these termites will be more poisonous than frogs consuming smaller amounts. Previous experiments have also shown that neurotoxin production is highest at low temperatures and decreases as temperatures increase.
A team of researchers is curious about when these frogs are most toxic. They record average monthly temperatures for a year and count the number of termites found within a 5,000 square foot area as a measure of termite density in the environment. Results are shown below.

During what month would you expect the frogs to have the highest levels of neurotoxin?
October
June
January
July
April
January
To find out when the frogs are most toxic we must look at the two variables affecting toxicity mentioned in the text: termite availability and temperature. Highest toxicity will be reached when frogs experience the lowest temperature and have the most termites available. Of all months, January has both the lowest temperature and highest termite density, making it the month where frogs will produce the most neurotoxin.
Example Question #124 : Act Science
A mycologist, a scientist specializing in the study of mushrooms, wants to compare the growth of three types of mushroom (A, B, and C) on varying growth substrates. He is also curious how light will affect the growth of each of the samples. He designs an experiment where each variety of mushroom will be grown on manure, wood chips, or rice flour and includes identical trials with and without light. He records the mass of the mushrooms produced after 14 days of fruiting and finds the following results:
| Mass of Mushrooms after 14 days of Fruiting (grams) | ||||||
| Exposed to Light | No Light Exposure | |||||
| Growth Substrate | Mushroom A | Mushroom B | Mushroom C | Mushroom A | Mushroom B | Mushroom C |
| Manure | 14.2 | 6.2 | 12.2 | 7.8 | 6.1 | 2.8 |
| Woodchips | 9.1 | 12.1 | 8.8 | 5.3 | 11.9 | 2.1 |
| Rice Flour | 2.4 | 9.3 | 19.4 | 1.1 | 9.4 | 19.3 |
Mushroom strain B produced the largest mushrooms when grown on which growth substrate?
Woodchips
Cannot be determined with the given results.
Mushroom strain B produced equally large mushrooms on all substrates tested.
Manure
Rice flour
Woodchips
Woodchips is the correct answer because mushroom strain B produced mushrooms with the highest mass in both the light exposed and non-light exposed conditions when grown on the woodchip substrate.
Example Question #123 : Act Science
A mycologist, a scientist specializing in the study of mushrooms, wants to compare the growth of three types of mushroom (A, B, and C) on varying growth substrates. He is also curious how light will affect the growth of each of the samples. He designs an experiment where each variety of mushroom will be grown on manure, wood chips, or rice flour and includes identical trials with and without light. He records the mass of the mushrooms produced after 14 days of fruiting and finds the following results:
| Mass of Mushrooms after 14 days of Fruiting (grams) | ||||||
| Exposed to Light | No Light Exposure | |||||
| Growth Substrate | Mushroom A | Mushroom B | Mushroom C | Mushroom A | Mushroom B | Mushroom C |
| Manure | 14.2 | 6.2 | 12.2 | 7.8 | 6.1 | 2.8 |
| Woodchips | 9.1 | 12.1 | 8.8 | 5.3 | 11.9 | 2.1 |
| Rice Flour | 2.4 | 9.3 | 19.4 | 1.1 | 9.4 | 19.3 |
What statement best describes the effect of light exposure on the mass of mushrooms that strain A produces?
Exposure to light increased the mass of mushrooms produced by strain A on manure and rice flour, but decreased the mass of mushrooms produced by strain A on woodchips.
Exposure to light had no effect on the mass of mushrooms produced by strain A.
Exposure to light increased the mass of mushrooms produced by strain A on all substrates.
Exposure to light decreased the mass of mushrooms produced by strain A on all substrates.
Exposure to light increased the mass of mushrooms produced by strain A on rice flour, but decreased the mass of mushrooms produced by strain A on manure and woodchips.
Exposure to light decreased the mass of mushrooms produced by strain A on all substrates.
The mass of mushrooms produced on all substrates by strain A when exposed to light was significantly less than those not exposed to light. Therefore, it can be inferred that exposure to light decreases strain A mass on all substrates.
Example Question #125 : Act Science
Researchers at a biotechnology company have just developed a new immortal line of mammalian cells derived from raccoon hair follicles. They dub these cells RHF and note that they appear particularly resistant to environmental stressors in initial experiments. They design a set of experiments to test the limits of the RHF cell line.
Experiment 1: The scientists inoculate 5 identical flasks containing growth media with samples of the RHF cells. The flasks are then incubated in separate incubators at varying temperatures. The flasks are sampled daily for cell density to analyze growth of the cells, yielding these results:
| Cell Density (million cells per mL) | |||||||
| Day | |||||||
| Temperature | 1 | 2 | 3 | 4 | 5 | 6 | 7 |
| 32 °C | 0.1 | 0.1 | 0.3 | 0.5 | 0.9 | 1.6 | 2.5 |
| 37 °C | 0.1 | 0.2 | 0.4 | 0.8 | 1.5 | 3.3 | 6.3 |
| 42 °C | 0.1 | 0.2 | 0.4 | 0.7 | 1.3 | 2.2 | 4.1 |
| 47 °C | 0.1 | 0.1 | 0.2 | 0.3 | 0.5 | 0.9 | 1.7 |
| 52 °C | 0.1 | 0 | 0 | 0 | 0 | 0 | 0 |
Experiment 2: The scientists produce 5 separate batches of cell growth media containing various amounts of salt to raise the osmolality of the solution. They inoculate 5 flasks, each with various osmolalities, then incubate the flasks at 37 °C for seven days. The flasks are sampled daily for cell density, yielding these results:
| Cell Density (million cells per mL) | |||||||
| Day | |||||||
| Osmolality (mOsm/kg) | 1 | 2 | 3 | 4 | 5 | 6 | 7 |
| 310 | 0.1 | 0.2 | 0.4 | 0.8 | 1.5 | 3.3 | 6.3 |
| 340 | 0.1 | 0.2 | 0.3 | 0.7 | 1.4 | 2.8 | 4.9 |
| 380 | 0.1 | 0.2 | 0.3 | 0.6 | 1 | 1.8 | 3.5 |
| 420 | 0.1 | 0.1 | 0.2 | 0.3 | 0.5 | 0.8 | 1.4 |
| 460 | 0.1 | 0.1 | 0.1 | 0.2 | 0.2 | 0.3 | 0.4 |
Describe the pattern of cell density over time of RHF cells grown at 
Linear growth
There is no pattern
Exponential growth
Exponential decrease
Linear decrease
Exponential growth
In the results of Experiment 1, cell density doubles each day in the 
Example Question #121 : How To Find Data Representation In Biology
A sports physician is conducting an experiment in which a competitive bicycle rider has her heart rate, oxygen content in blood, and blood lactate measured. The measurements are taken at resting, during easy, moderate, difficult, and very difficult exercise. The results are summarized in the table below. Please note that the oxygen content was normalized to the resting oxygen content.

If the cyclist was to exert herself even more to a heart rate of 160 bpm, what would be the expected oxygen percentage?
75%
65%
80%
70%
Cannot be determined from the given information
75%
It can be seen in the data that for every increase in heart rate by 20 bpm that the measured oxygen decreases by 5%. 160 bpm was an increase of 20 bpm from 140 bpm so there was a decrease of 5% from 80% in oxygen. This means the anticipated oxygen level is 75%.
Example Question #127 : Act Science
Three different species of bacteria were grown in the laboratory. The experiment measured the effect of pH on the concentration of the three species of bacteria. The graphs below show the concentration of bacteria at different pH levels. Figure 2 shows the effect of pH on the concentration of a third bacterial strain, bacteria C.

Which of the following is not an accurate conclusion that can be drawn from the graph in Figure 1?
Both bacteria A and bacteria B can coexist in an environment with a pH of 8.4
A medium with a pH of 8.0 would consist of a higher concentration of bacteria A than bacteria B
Bacteria A is able to survive in an environment with low pH
A medium with a pH of 11.0 would consist of solely bacteria B
The concentration of bacteria A is affected by the concentration of bacteria B
The concentration of bacteria A is affected by the concentration of bacteria B
Based on the graph both bacteria A and bacteria B show low concentrations in pH 7.5 through pH 10. Bacteria A showed concentrations in low to neutral pH. Also, looking at the graph one can see that at pH 11.0 only concentrations of bacteria B are present while a pH of 8.0 showed a higher concentration of bacteria A than bacteria B. One cannot infer solely from the data in the graph that the concentration of each species of bacteria had an effect on the other, making it the correct answer.
Example Question #122 : How To Find Data Representation In Biology
Three different species of bacteria were grown in the laboratory. The experiment measured the effect of pH on the concentration of the three species of bacteria. The graphs below show the concentration of bacteria at different pH levels. Figure 2 shows the effect of pH on the concentration of a third bacterial strain, bacteria C.
Which species of bacteria would be seen in concentrations over 0 on a medium with neutral pH?
Bacteria A
Bacteria A, Bacteria B, and Bacteria C
Bacteria A and Bacteria C
Bacteria A and Bacteria B
Bacteria B
Bacteria A, Bacteria B, and Bacteria C
Bacteria A, bacteria B and bacteria C have concentrations over 0 in figures 1 and 2.
Example Question #123 : How To Find Data Representation In Biology
The population of two different sparrow varieties were recorded from spring 1992 to fall 1996 and displayed below in the form of a graph.

Upon studying the graph provided, which of these is a plausible conclusion?
One species is more adaptively superior to the other
Mating for both species happen in the fall
None of the other choices can be concluded from the graph.
Only one species is involved
There are almost always more spotted sparrows in the fall than in the spring each year
There are almost always more spotted sparrows in the fall than in the spring each year
There is no way to ascertain that both varieties of sparrow are separate species just from studying the graph and the same reasoning stands for determining whether one species is superior to the other. The only option that can be concluded from studying the graph is that every year there are more spotted sparrows in the fall than in the spring.

Certified Tutor

Certified Tutor

All ACT Science Resources

