Statistics : Statistics
Study concepts, example questions & explanations for Statistics


All Statistics Resources
Example Questions
Example Question #1 : Analysis Of Variance
Calculate the standard deviation of the following data set:


Cannot be determined

The standard deviation is found by using the following formula:

We will start by identifying the components of this equation:


Now, we can use this information to calculate the standard deviation.
First, we need to identify 


Next, we need to calculate the mean:


Second, we need to find the square of the absolute of each variable minus the mean:


Last, let's substitute these values into the standard deviation formula and solve.
}{6}}")

Solve.

Example Question #1 : Statistics
Which of the following is not considered to be a test statistic of a sample population?


None of these

A sample statistic is a calculation that describes a sample. Samples are representative of larger populations; therefore, test statistics provide us with insights of larger populations. On the other hand, populations are entire groups that are described by parameters. The greek letter mu—or 
Example Question #1 : Coefficients
Which of the following best describes a data set with a correlation coefficient equal to zero?
Negative
Positive
Moderately positive
Random
Moderately negative
Random
In order to solve this problem, we need to understand several key concepts associated with correlations. First, let's discuss what is meant by the term "correlation." A correlation exists when two variables possess a statistical relationship with one another. It is important to note that correlation in no way relates to causation. Causation implies that one variable causes change in the other, while correlation simply denotes the observation of a trend between two variables.
Second, let's observe the differences between slope and the correlation coefficient. The correlation coefficient is denoted by the following variable.

It is mathematically defined as a goodness of fit measure that is calculated by dividing the covariance of the samples by the product of the sample's standard deviations. This is also known as Pearson's r and it describes the strength and direction of a linear relationship between two variables. On the other hand, the slope is described as the gradient of a line and is key component of the slope intercept formula:

This formula provides information about two key parts of a line: the slope and y-intercept.

The slope is commonly defined as rise over run. In other words it is the change in y-values across points divided by the change in x-values. It is calculated using the following formula:


In this formula, the x and y-values come from two points from the line written in the following format:
")
It is important to note that slopes can be positive or negative. A positive slope moves upward from left to right while a negative slope moves downward. Even though the correlation coefficient will share the same sign as the slope, they mean entirely different things.
We have discussed the following distinctions: the differences between what is meant correlation and causation as well as the differences between the correlation coefficient and the slope. Now, we can start to solve the problem.
First, lets learn how calculate the correlation coefficient from coefficient of determination. The coefficient of determination is denoted by the following:

We can calculate the correlation coefficient by taking the square root of the coefficient of determination:

After we calculate the correlation coefficient, we need to know how to evaluate what the number means. We can pick the sign based on the position of the trendline or slope. If the slope is negative then the trendline travels downward from the left to the right of the graph. On the other hand, if the slope is positive then the trendline travels upwards from the left to the right side of the graph. Below is a table of values that explains the relationships between points based upon the correlation coefficient. A correlation coefficient close to zero indicates a random distribution.

Let's look at several examples. The following two graphs possess a positive and moderately positive trendline, respectively:


Graphs can possess a negative and slightly negative trendlines, respectively:


Last, a graph with a near horizontal line is indicative of a random distribution; therefore, the answer to the question is "random."

Example Question #1 : Normal Distributions
A student scores a 


Using this information, determine whether or not the student scored well on the SAT.
The student scored poorly: below a single standard deviation of the mean.
The student's score was average: similar to the mean.
The student scored well: above a single standard deviation of the mean.
The student scored very poorly: below two standard deviations of the mean.
The student scored very well: above two standard deviations of the mean.
The student scored very well: above two standard deviations of the mean.
In order to solve this problem let's consider probabilities and the normal—bell curve—distribution. Given that all events are equally likely, probability is calculated using the following formula:

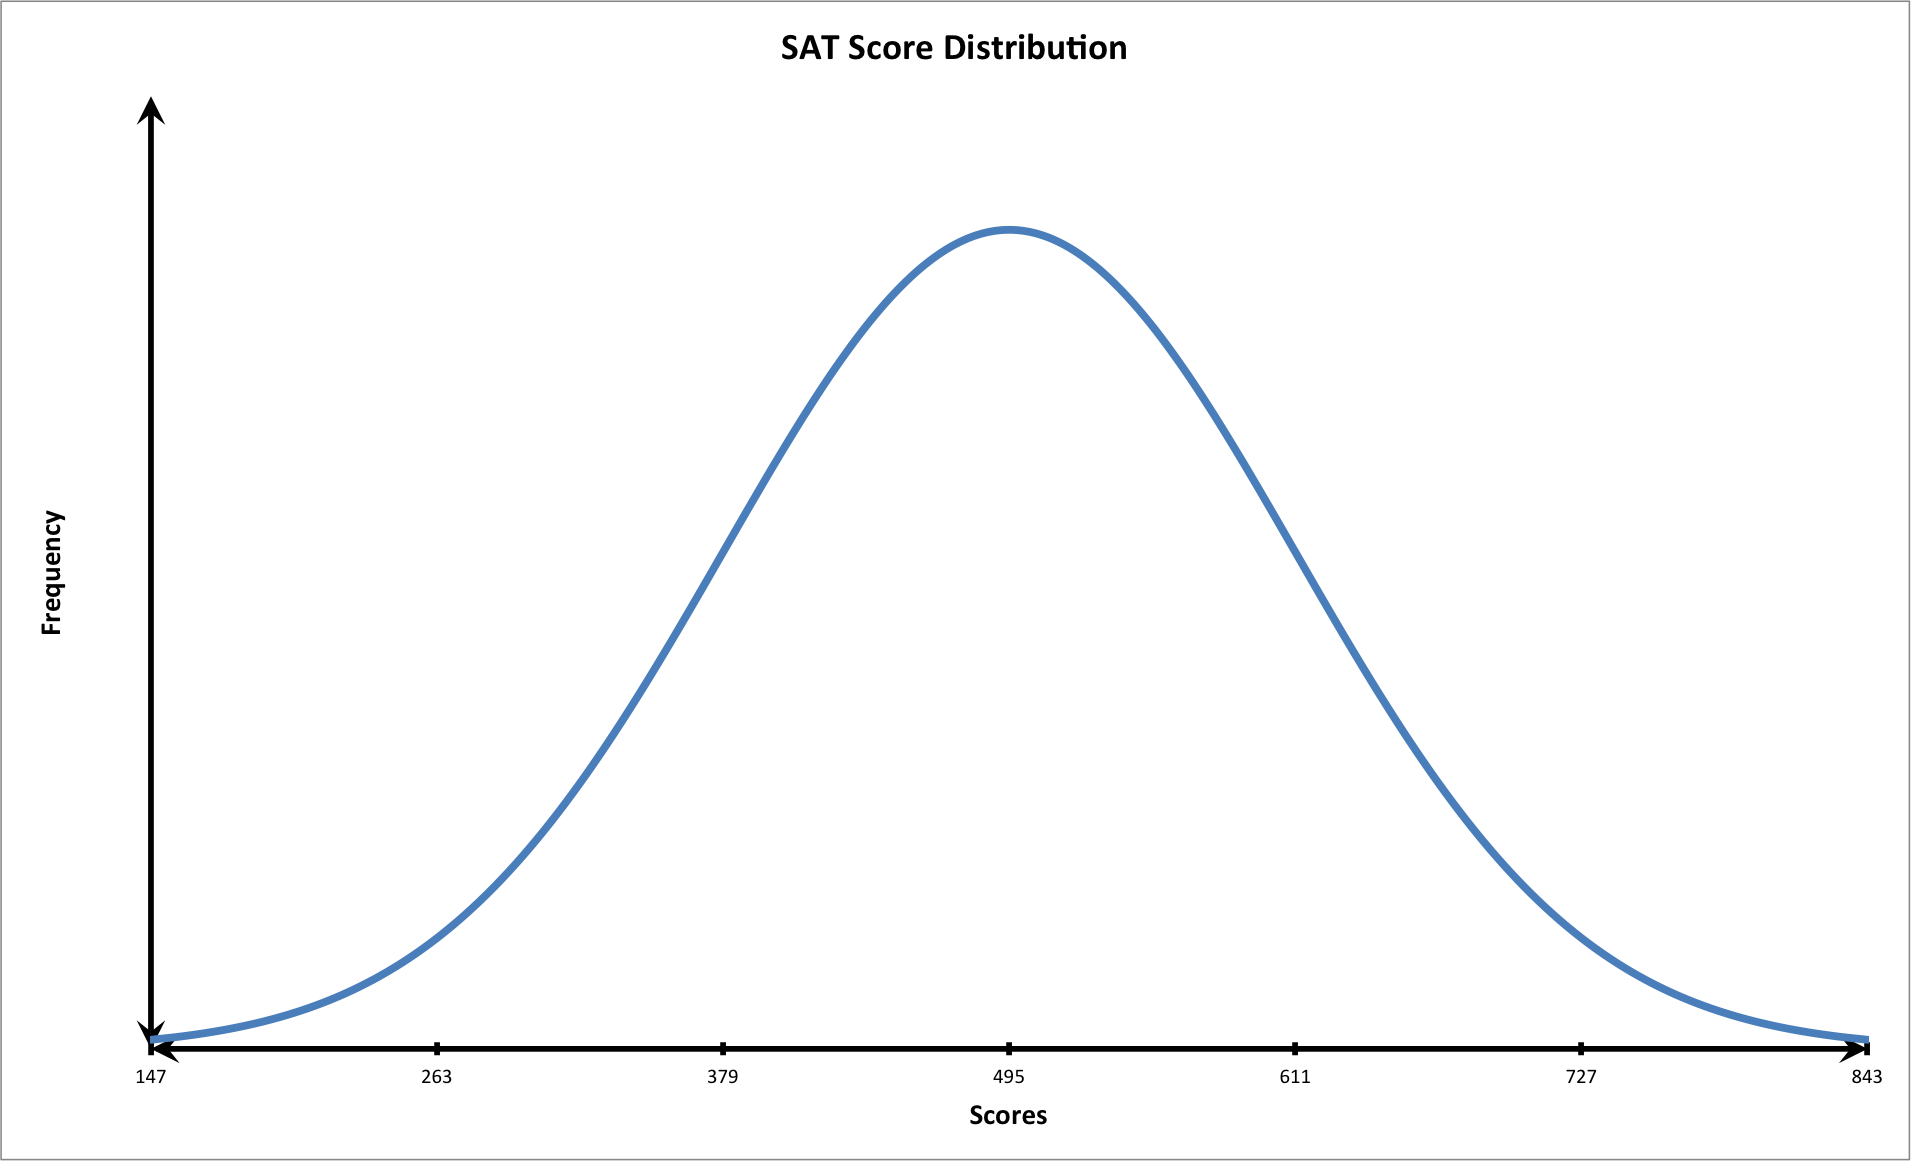
When probabilities of a given population are calculated for particular events, they can be graphed in a frequency chart or histogram. If they form a standard distribution, then the graph will form to the following shape:

This shape is known as a bell curve. In this curve, the mean is known as the arithmetic average and is represented as the peak. The mean alters the position of the graph. If the mean increases or decreases, then the graph shifts to the right or to the left respectively. The mean is denoted as follows:

On the other hand, the standard deviation is a calculation that indicates the average amount that each value deviates from the mean. When the standard deviation is changed then the shape of the graph is altered. When the standard deviation is decreased, the graph is taller and thinner. Likewise, when the standard deviation is increased, the graph becomes shorter and wider. It is important to note that 99.7 percent of all the values in a normal population exist between three standard deviations above and below the mean. It is denoted using the following annotation:

Now that we have discussed the components of the bell curve, let's consider the scenario presented in the question.
We know that the distribution of test scores follows a normal curve. We also know the following values:


We should first plot the data on a graph that follows the shape of a bell shaped curve with three standard deviations.
We know that the student had the following score:

Let's calculate two standard deviations above the mean.
+\bar{x}=(2\times116)+495=727")
The student scored very well: above two standard deviations from the mean. Notice that at this point on the graph, the tail of the curve is closer to the horizontal or x-axis. This means that fewer students scored this high on the exam. In other words, the student performed very well.
Example Question #1 : Skewed Distributions
A social scientist performs an experiment testing the frequency and correlation of several demographics. She plots a histogram measuring income versus education level. She produces the following graph:
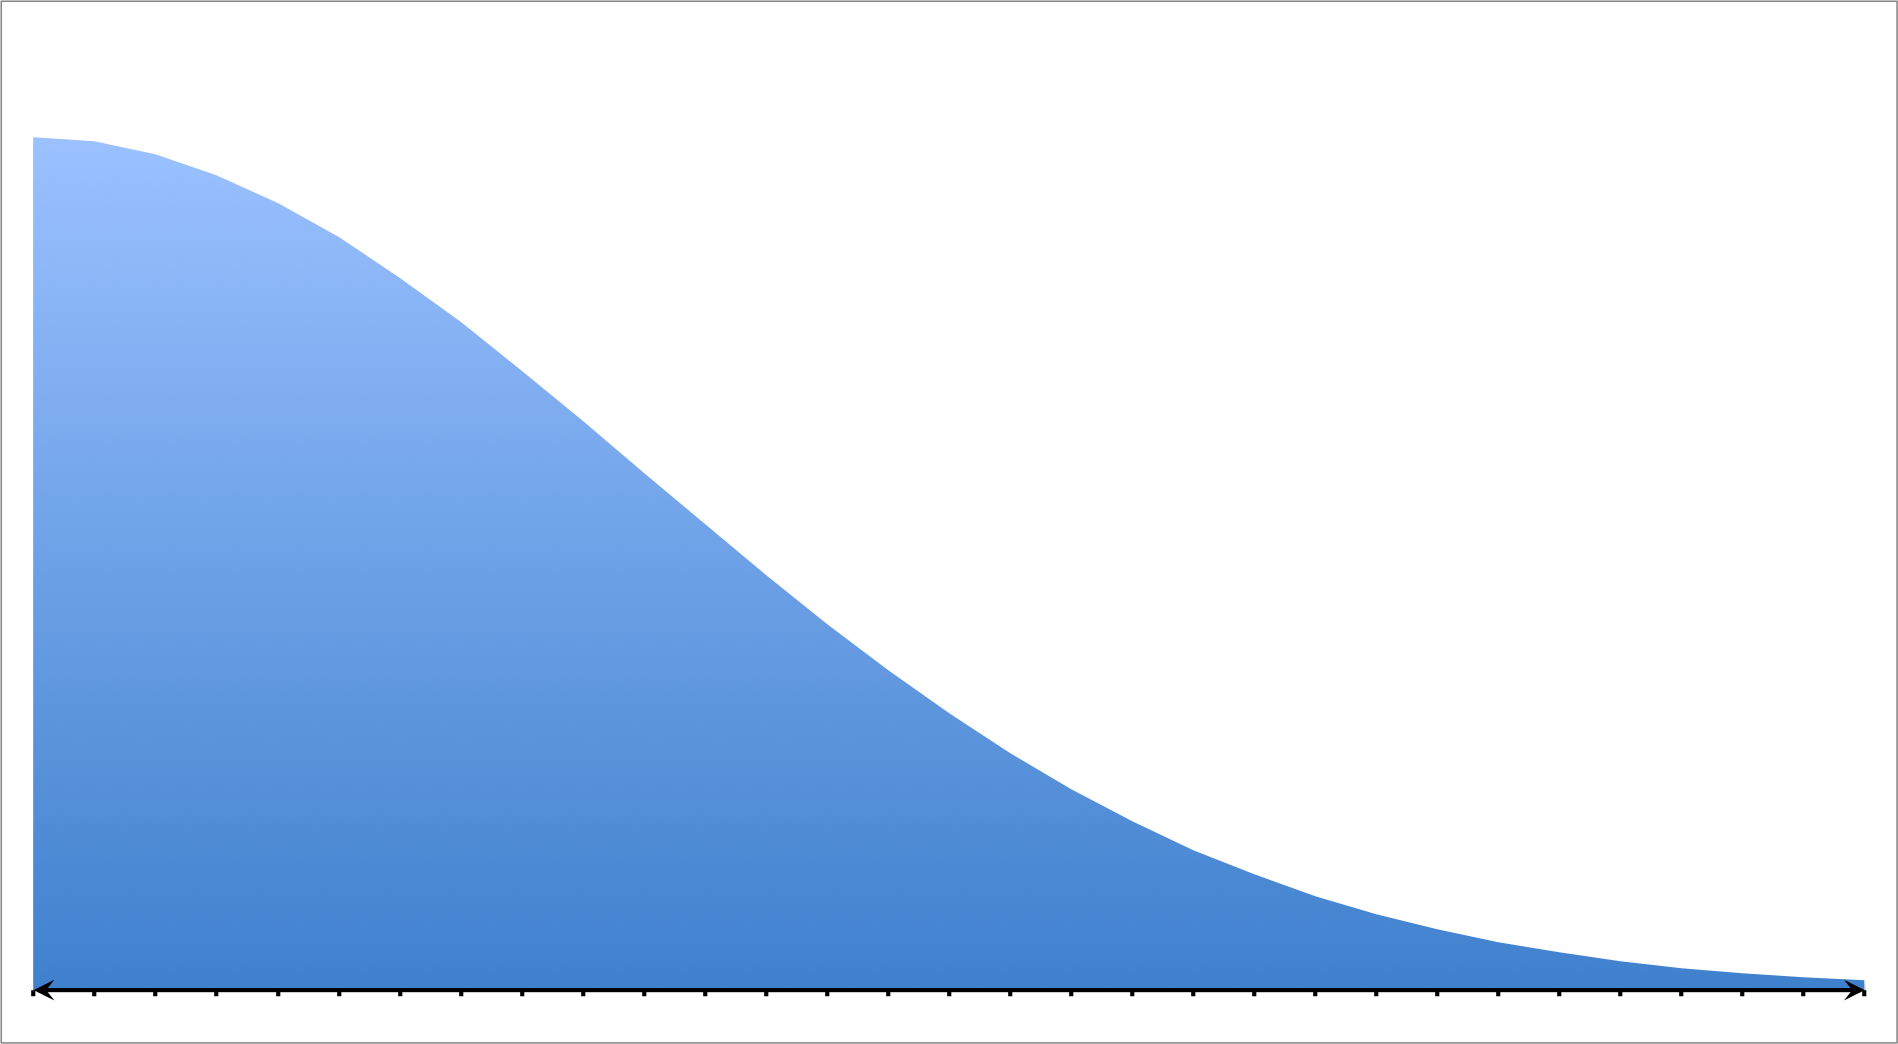
Which of the following choices best describes this model?
Bimodal
Uniform
Right Skewed
None of these
Left Skewed
Right Skewed
In order to solve this problem let's review the following distributions: normal, positive/right skewed, negative/left skewed, bimodal, and uniform.
Normal Distribution:

A normal distribution is also known as a bell curve. Data that form a bell curve have three primary characteristics: the data is single peaked meaning that it has a single mode, it is symmetrical, and contains no outliers.
Positive/Right Skewed Distribution
A positive or right skewed distribution has a longer tail on the right side due to outliers while the majority of the points are concentrated on the left side of the graph. In other words, the set favors probabilities on the left of the model.
Negative/Left Skewed Distribution

A negative or left skewed distribution has a longer tail on the left side due to outliers while the majority of the points are concentrated on the right side of the graph. In other words, the set favors probabilities on the right of the model.
Bimodal Distribution

In a bimodal distribution, there are two peaks due to several modes in the data set. These multiple central tendencies are the result of two or more favorable probabilities in the set.
Uniform Distribution

In a uniform distribution the data points form a a rectangle. These models are formed when data points possess a constant probability.
The model in the question matches that or a positive or right skewed distribution; therefore, the correct answer is "right skewed."
Example Question #1 : Type I
Type I errors occur when a researcher incorrectly __________ the ___________ hypothesis; therefore, they erroneously accept the __________ hypothesis.
None of these
rejects. . . alternative. . . null
accepts. . . null. . . alternative
accepts. . . alternative. . . null
rejects. . . null. . . alternative
rejects. . . null. . . alternative
Type I errors are made when a researcher incorrectly rejects the null hypothesis and erroneously accepts the alternative hypothesis. For example, a researcher may incorrectly conclude that two plant treatments are different by erroneously rejecting the null hypothesis. As a result they may assume that they have differing effects when they are—in fact— the same.
Example Question #1 : Type Ii
Type II errors occur when a researcher incorrectly __________ the ___________ hypothesis; therefore, they erroneously reject the __________ hypothesis.
rejects. . . null. . . alternative
accepts. . . null. . . alternative
None of these
accepts. . . alternative. . . null
rejects. . . alternative. . . null
accepts. . . null. . . alternative
Type II errors occur when we fail to reject a false null hypothesis. As a result, the researcher will incorrectly accept the null hypothesis and erroneously reject the alternative hypothesis. This commonly occurs when sample sizes are small. Larger sample sizes ensure that statistical measures will identify a practical difference when one truly exists.
Example Question #1 : Probability
There are four different colored marbles in a jar—red, blue, white, and black—calculate how many outcomes are possible if a person picks two of the marbles if the order in which the marbles are picked matters.


Cannot be determined

Outcomes are not always easily identified or calculated; however, mathematical operations associated with permutations and combinations can make these processes easier. Permutations provide the number of outcomes when the order of events matter. Permutations are calculated using the following formula:
!}")
In this formula, the variable, 

Let's use this information to solve the problem. We know that this is a permutation because the order of the marbles matters. We need to assign numbers to each of the variables we have for items or marbles and we have two slots or bins that they are to be ordered into; therefore, we know the following:
!}")
Now, we need to calculate the number of permutations present in this model; however, we need to understand how to perform calculations involving factorials. Factorials are denoted with an exclamation point (!). For example, let's observe the following operation:

This denotes that for every non-negative integer, 

Let's use this information to solve our marble example.
!}")

Solve.

Simplify.

We know that there are twelve possible permutations.
Example Question #2 : Probability
What is the probability of drawing an ace from a standard deck of fifty-two cards?


In order to solve this standard, we need to understand how to calculate the probability of simple events. A probability is generally defined as the chances or likelihood of an event occurring. It is calculated by identifying two components: the event and the sample space. The event is defined as the favorable outcome or success that we wish to observe. On the other hand, the sample space is defined as the set of all possible outcomes for the event. Mathematically we calculate probabilities by dividing the event by the sample space:

Let's use this information to solve our problem. We want to know the probability of drawing an ace from a deck of cards. We know that the sample space is fifty-two because there are fifty two cards or outcomes in the deck. Also, we know that there are only four aces in a fair deck of cards; therefore,

Now, let's convert this into a percentage:


Probabilities expressed in fraction form will have values between zero and one. One indicates that an event will definitely occur, while zero indicates that an event will not occur. Likewise, probabilities expressed as percentages possess values between zero and one hundred percent where probabilities closer to zero are unlikely to occur and those close to one hundred percent are more likely to occur.

Example Question #3 : Probability
What is the probability of rolling "snake eyes"—a value of one on two separate dice—using two fair dice?


In order to solve this standard, we need to understand two primary components: probabilities and the property of independent events. A probability is generally defined as the chances or likelihood of an event occurring. It is calculated by identifying two components: the event and the sample space. The event is defined as the favorable outcome or success that we wish to observe. On the other hand, the sample space is defined as the set of all possible outcomes for the event. Mathematically we calculate probabilities by dividing the event by the sample space:
Let's use this information to solve our problem. First, let's calculate the probability of rolling a one. There is a single side of the die that has a value of one and there are six total sides on the die; therefore, we can write the following formula:
=\frac{\textup{event: particular phenomenon we wish to observe}}{\textup{sample space: total number of possible outcomes}}")
=\frac{1}{6}")
Now, let's find the probability of rolling a two on a separate die in the same roll.
=\frac{\textup{event: particular phenomenon we wish to observe}}{\textup{sample space: total number of possible outcomes}}")
=\frac{1}{6}")
Last, we need multiply these two probabilities together.
=P(rolling\ one\ on\ the\ first\ die) \times P(rolling\ one\ on\ the\ second\ die)")
=\frac{1}{6}\times \frac{1}{6}")
=\frac{1}{36}")

Certified Tutor

Certified Tutor

All Statistics Resources

